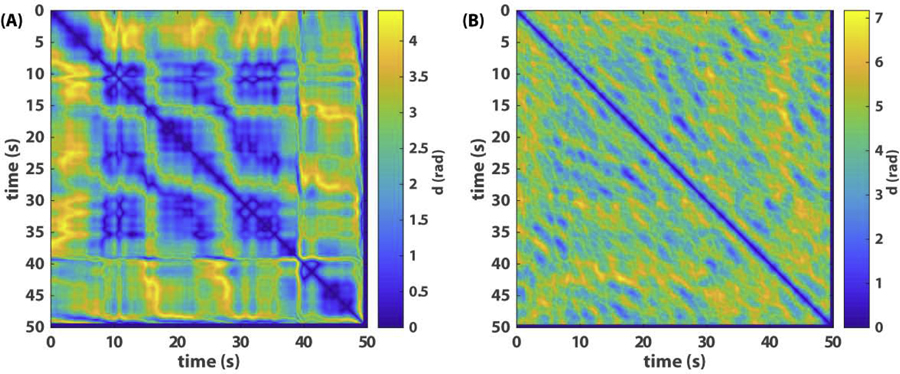
Fig 3. Recurrence plots of relative phase dynamics.
(A) shows the recurrence plot of phase relations among three agents where the state variable is a vector with the 2 relative phases shown in Fig 1A as components, and (B) recurrence plot of eight agents where the state variable is a vector of the 7 relative phases plotted in Fig 2A as components.

