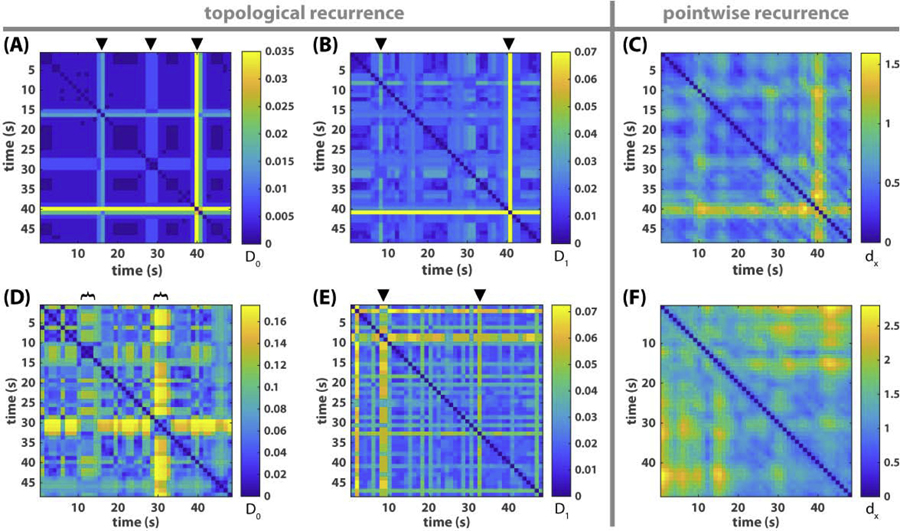
Fig 8. Topological versus pointwise recurrence plots of metastable dynamics.
(A-B) shows the recurrence of connected components and loops respectively for the triadic example of Fig 1, where the color of each pixel indicates the topological distance between segments of the frequency-phase graph at time x and time y, as defined in Eq 8, i.e. D0(X(x), X(y)) for (A), D1(X(x), X(y)) for (B). Black triangles on top mark the time of topological transitions. They correspond very well with transitions in the original relative phase dynamics (Fig 1A) and its associated recurrence plot (Fig 3A). (C) shows the pointwise recurrence plot of the triadic example, where the color of each pixel reflects the distance between point clouds X(x) and X(y) as state vectors, as defined in Eq 9, instead of their multiscale topological portraits. Similar transitions also appear in (C) as in (A-B) though less sharp. (D-F) shows the corresponding recurrence plots for the eight-agent example of Fig 2. In the recurrence plot of connected components (D), two transitions are apparent, each of which lasts about 5s (marked by black brackets). The onset of the first transition (around 10s) and the offset of the second (about 33s) also stand out in the recurrence plot of loops (E), marked by black triangles. These features are not apparent in the pointwise recurrence plot of the frequency-phase graph (F), or the recurrence of relative phase (Fig 3B).

