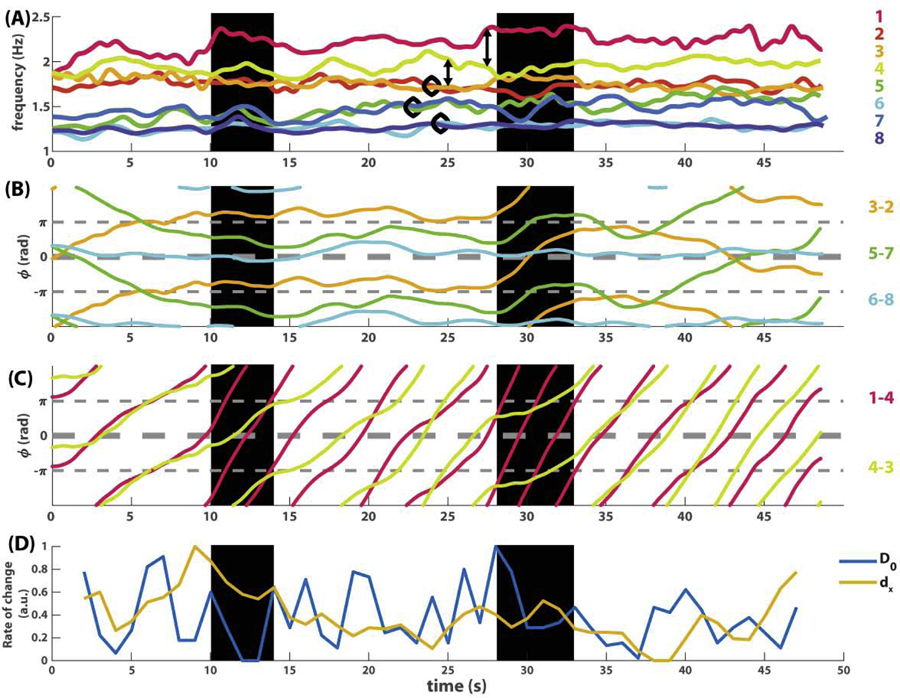
Fig 9. Examining the dynamic relevance of topological transitions in the eight-agent example.
(A-C) shows trajectories of frequency and relative phase from Fig 2, smoothed out by a 2s moving average. (A) shows the frequency dynamics of all eight agents. (B) shows the dynamics of three slowly varying relative phases (thickened trajectories in Fig 2A), corresponding to three pairs of frequency trajectories enclosed by black circles in (A). (C) shows the dynamics of two fast varying relative phases (among the thin trajectories in Fig 2A), corresponding to relations between frequency trajectories connected by double arrows in (A). (D) shows the rate of change of connected components (blue trajectory) and pointwise rate of change (yellow trajectory), which is the distance between two consecutive multiscale topological portraits under the metric D0 (Eq 8) and dx (Eq 9) respectively. Both trajectories are normalized by mapping for comparison. Two transitional periods seen in Fig 8D are highlighted with black backgrounds, bordered by adjacent peaks in the blue trajectory in (D). See text for interpretation.

