
Figure 1:
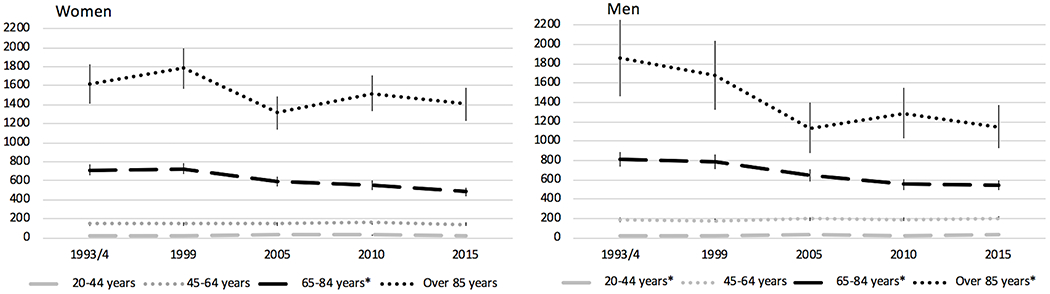
Incidence Rates of All Strokes per 100,000 by Sex and Age Group over Time
Incidence rates are per 100,000 with 95% CI and have been adjusted for age and race, standardized to 2010 U.S. Census population
*p<0.05 for change in incidence between 1993/4 and 2015