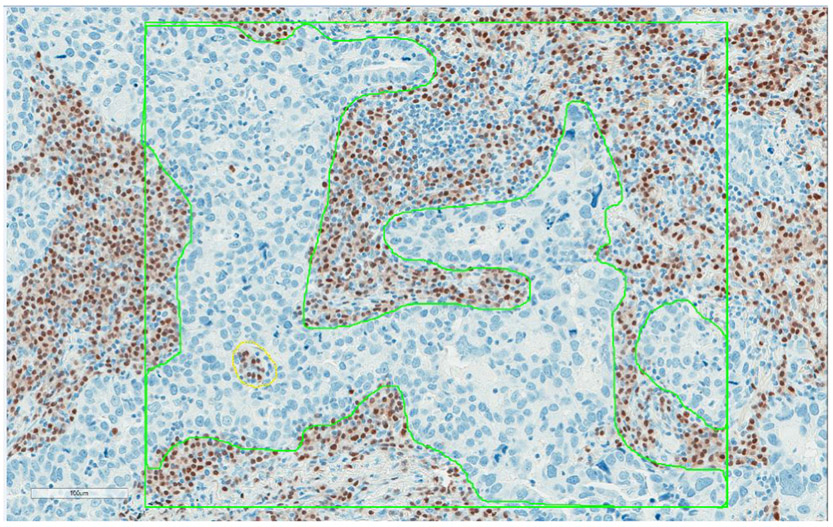
Figure 1:

Digital image analysis of MUM1+ plasma cells in resected lung adenocarcinomas. The green box indicates the area measured by digital image analysis. A total of five boxes were placed on the representative areas (3 along the periphery of the tumor and 2 in the tumor center) on each case. The boxes were placed on the CD3 image first and this was used as a guide to place tiles in the same location on the CD20 and MUM1 images. A second annotation layer was added and only epithelial tumor cells were traced. Analyses were run on both (boxes and tracings) layers of annotations to get tumor-infiltrating immune cells in intraepithelial and stromal compartments of tumor separately.
