
Fig. 4. Identifying the SM reaction intermediate and product by simultaneous Raman and fluorescence spectroscopy.
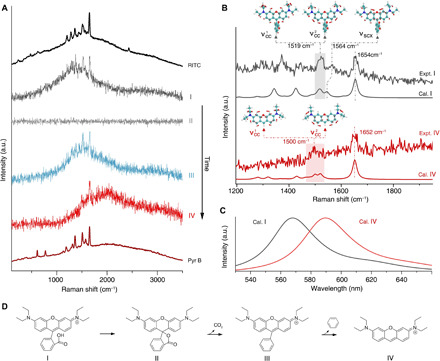
(A) Average spectra of SM spectroscopy of RITC during ~11.5 to 12.60 s (I), ~12.65 to 15 s (II), ~15.05 to 15.65 s (III), and ~15.70 to 16.3 s (IV). These spectra represent four distinct states during the structural evolution of an RITC molecule until the final photobleaching of the xanthene group. The SM event corresponds to the one shown in Fig. 3. Ensemble surface-enhanced emission spectra of RITC and Pyr B are presented at the top and bottom for reference, respectively. (B) Experimental and calculated resonant Raman features of structures I and IV. The insets illustrate the vibrational normal modes of νcc and νscx that are associated with the symmetrical stretching of C─C in side phenyls and the stretching mode of central xanthene accompanying stretching of the C─C bond between central xanthene and carboxyphenyl, respectively. (C) DFT-calculated fluorescence spectra of structures I and IV. (D) Proposed reaction pathway of a single RITC molecule (I) experiencing structural transformation to a lactonic form (II) and the subsequent bond cleavage reactions (III and IV), where the thiourea anchoring group attached to the substrate is omitted.