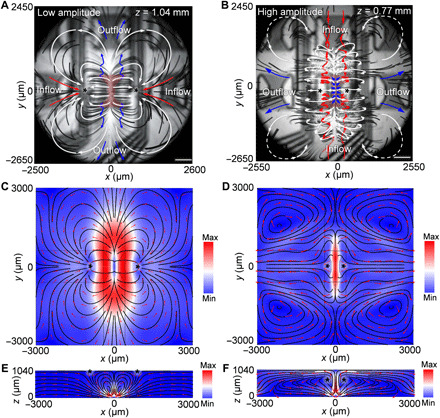
Fig. 2. Mechanism of droplet actuation via ASVs.

(A) The xy-plane composite image of particle trajectories generated from stacked, bottom-view images of particles near one flank of a transducer when excited by a low-amplitude signal near the surface of the oil (z = 1.04 mm). (B) xy plane of particle trajectories generated from the stacked, bottom-view images of particles near one flank of a transducer when excited by a high-amplitude signal beneath the surface of the oil (z = 0.77 mm). The blue arrows indicate the trajectories of fluid being pumped outward. Red arrows indicate the trajectories of fluid pumping inward. White arrows indicate the trajectories of recirculating flows. The shaded red areas indicate the location of the actuated transducers. (C) Numerical simulation results showing the acoustic streaming pattern in the xy plane (z = 1.04 mm) with a low-amplitude excitation signal. (D) Numerical simulation results showing the acoustic streaming pattern in the xy plane (z = 0.77 mm) with a high-amplitude excitation signal. Simulation results showing the acoustic streaming pattern in the xz plane (y = 0 mm) with (E) a low- and (F) a high-amplitude excitation signal. The black asterisks indicate the hydrodynamic equilibrium positions. Scale bars, 500 μm.
