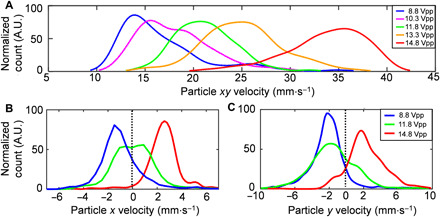
Fig. 3. PIV analysis with increasing excitation amplitude.

(A) The particle velocity distributions around the ASVs (z = 1.04 mm; on the oil surface) as the excitation voltage is increased. A.U., arbitrary units. (B) The velocity distribution of the particles, escaping from the transducer along x axis (i.e., x velocity) over the flanks of the transducer (z = 1.04 mm; on the oil surface), shifts toward the right side of the graph as the excitation voltage increases. (C) The velocity distribution of the particles moving away from the transducer along the y axis (i.e., y velocity) near the aperture of the transducer (z = 0.77 mm; inside the carrier oil) also shifts to the right in the graph as the excitation voltage increases. The dashed line indicates zero particle velocity (i.e., static particles). Note that the particle trajectories of the higher speed inflow are obscured by those of the overlapping channel vortices. (B) and (C) share the same legend. The normalized particle count is derived through PIV analysis on small regions of interest (ROIs) and then normalized simplified visualization of the data. The ROIs for (A) to (C) are indicated by dashed squares in fig. S2.
