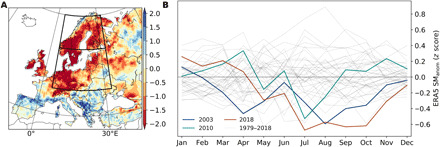
Fig. 1. Drought patterns in summer 2018.

(A) Spatial distribution of SM anomaly (SManom) from ERA5 fields (see Materials and Methods) in summer (JJA) and (B) distribution of seasonal SManom at continental scale for the study period 1979–2018 (gray lines) and the corresponding trajectories in 2003, 2010, and 2018. Continental Europe refers to the domain within 32°N and 75°N and −11°E and 65°E.
