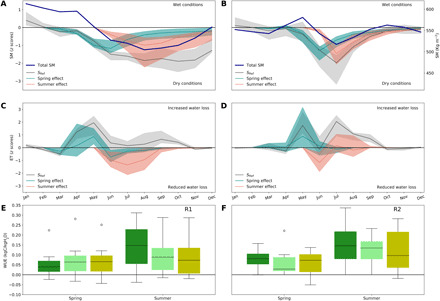
Fig. 5. Seasonal evolution of hydrological variables during 2018 in the two study regions.

Standardized anomalies in total SM from the MMEM of the reference simulation (black line) and its uncertainty (shaded gray area) in R1 (A) and R2 (B). The blue (red) line indicates the individual effect of spring (summer) climate, and the interquartile range is shown by the shaded area. Absolute regional average SM values (in kg m−2) are given by the blue lines. The corresponding anomalies in ET are shown in (C) and (D) for R1 and R2, respectively. The distribution of the anomalies in WUE (defined as GPP/ET) estimated by the DGVM ensemble for forests (dark green), grasslands (light green), and croplands (yellow) in R1 (E) and R2 (F) during spring and summer 2018. WUE per land-cover type was calculated by weighting pixel-scale WUE by the corresponding pixel land-cover fraction of forests, grasslands, and croplands. It should be noted that these values will still include mixed signals from the three vegetation classes, especially in R1 where land-cover composition per pixel is more mixed.
