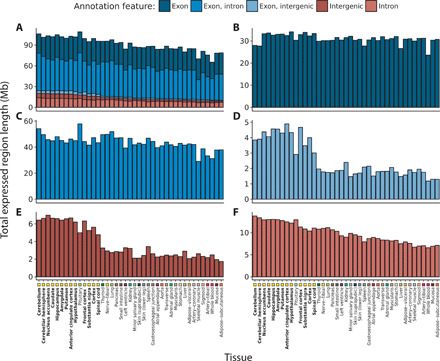
Fig. 2. Transcription detected across 41 GTEx tissues categorized by annotation feature.

Within each tissue, the length of the ERs Mb overlapping (A) all annotation features, (B) purely exons, (C) exons and introns, (D) exons and intergenic regions, (E) purely intergenic regions, and (F) purely introns according to Ensembl v92 was computed. Tissues are plotted in descending order based on the respective total size of intronic and intergenic regions. Tissues are color-coded as indicated in the x axis, with GTEx brain regions highlighted with bold font. At least 8.4 Mb of previously unannotated transcription was discovered in each tissue, with the greatest quantity found within brain tissues (mean across brain tissues, 18.6 Mb; nonbrain, 11.2 Mb; two-sided Wilcoxon rank sum test, P = 2.35 × 10⁻¹⁰.
