
Fig. 3. Validation of unannotated transcription.
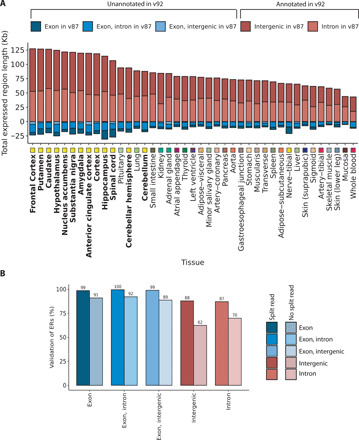
(A) The classification of ERs based on v87 and v92 of Ensembl was compared. Across all tissues, the number of intron or intergenic ERs with respect to v87 that were known to be exonic in Ensembl v92 was greater than the number of ERs overlapping exons according to v87 that were now unannotated in v92. Tissues are plotted in descending order based on the total Mb of unannotated ERs with respect to Ensembl v87 that were validated (classified as exonic in the Ensembl v92). Tissues are color-coded as indicated in the x axis, with GTEx brain regions highlighted with bold font. (B) Bar plot represents the percentage of ERs seeding from the GTEx frontal cortex that validated in an independent frontal cortex RNA-seq dataset. ERs defined in the seed tissue were requantified using coverage from the validation dataset, after which the optimized MCC was applied to determine validated ERs. Colors represent the different annotation features that the ERs overlapped, and the shade indicates whether the ER was supported by junction read(s).