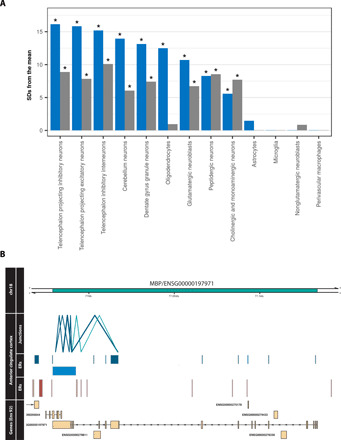
Fig. 5. Incomplete annotation of genes disproportionately affects oligodendrocytes.

(A) Bar plot displaying the enrichment of reannotated and not reannotated genes within brain cell type–specific gene sets. Blue bars represent the reannotated genes, and gray are those without reannotations. Of all analyzed cell types, the greatest difference between enrichment of reannotated and not reannotated was observed in oligodendrocytes. “*“ represents FDR-corrected P = <0.05. (B) Previously unannotated potentially protein-coding ER discovered in MBP, with an oligodendrocyte-specific expression pattern. The two junction reads in green intersect both the unannotated ER and also the known exons of MBP.
