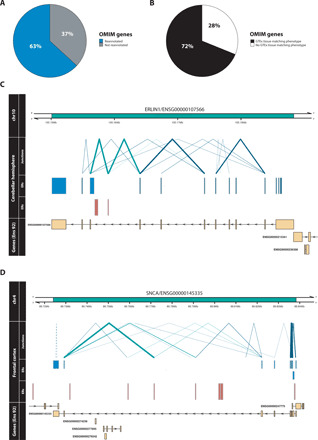
Fig. 6. Reannotation of OMIM genes.

(A) A previously unannotated ER connected through a junction read was discovered for 63% of OMIM-morbid genes. (B) Comparison of the phenotype (HPO terms) associated with each reannotated OMIM-morbid gene and the GTEx tissue from which unannotated ERs were derived. Through manual inspection, HPO terms were matched to disease-relevant GTEx tissues and for 72% of reannotated OMIM genes, the associated unannotated ER was detected in the phenotype-relevant tissue. Visualized examples of reannotated OMIM-morbid genes (C) ERLIN1 and (D) SNCA. Top track represents the genomic region including the gene of interest marked in green. Second group of tracks detail the junction reads and ERs overlapping the genomic region derived from the labeled tissue. Blue ERs overlap known exonic regions, and red ERs fall within intronic or intergenic regions. Blue junction reads overlap blue ERs, while green junction reads overlap both red and blue ERs, connecting unannotated ERs to OMIM-morbid genes. Thickness of junction reads represents the proportion of samples of that tissue in which the junction read was detected. Only partially annotated junction reads (solid lines) and unannotated junction reads (dashed lines) are plotted. The last track displays the genes within the region according to Ensembl v92, with all known exons of the gene collapsed into one “meta” transcript.
