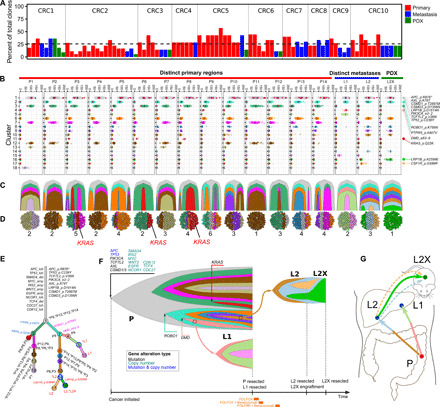
Fig. 3. CRC has substantial heterogeneity reflected in metastatic progression and establishment of PDXs.

(A) Percentage of total patient cancer clones detected in individual samples. (B to G) Clonal heterogeneity and evolution in patient CRC2. (B) Clustering of variants displaying purity-corrected cancer cellular fraction (CCF) across 14 primary regions, 2 metastases, and a PDX. Black bars, mean CCFs; red dots, nonsilent mutations in cancer genes (details on the far right). (C) Fishplot of clonal evolution and (D) clonal admixture of individual samples. (E) Clonal evolution tree with branch length scaled by the square root of the number of clonal marker variants. (F) Fishplot of the clonal evolution across all samples (time not to scale; sample acquisitions at the right end). Treatments are presented at the bottom. Primary tumor is presented as a combination of all primary regions. Arrows indicate metastasis seeding. Cancer genes, whose somatic alterations are clonal markers of a clone, are indicated with arrows pointing to the tips of the fishplot corresponding to the clone. (G) Anatomic representation of tumor location and metastatic progression. Arrows represent seeding clones between samples/sites. Dashed arrows represent clones regressed in PDX. Colors are matched throughout panels (B to G).
