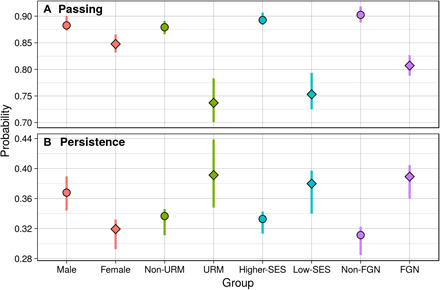
Fig. 3. Probability of passing and persisting in general chemistry as a function of student subgroup.

(A) Passing rate, calculated as 1 − DFW rate, with DFW defined as either a grade <1.7 or withdrawal from GenChem 1 (at this institution, a 1.7 is considered a C−). (B) Persistence is defined as going on to GenChem 2 for students who took GenChem 1 and were eligible to go on in the series (received a grade of 1.7 or higher). In both graphs, vertical bars indicate SEs derived using bootstraps (number of replicates = 100; number of students per replicate = 5000). “FGN” indicates first-generation students.
