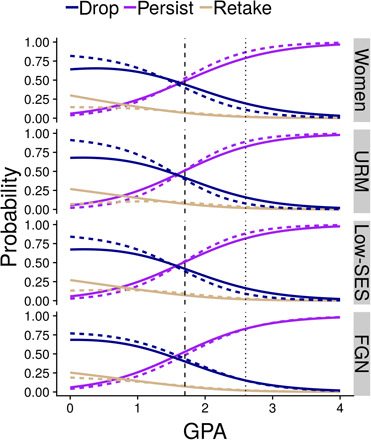
Fig. 4. Consequences of GenChem 1 grades, controlled for indices of academic preparation, for four student subgroups.

The vertical line at 1.7 indicates a threshold, below which a student is not allowed to move on to the next course in the series. The vertical line at 2.6 shows the “fixed” median grade used by the chemistry department to put scores from different sections on the same scale. A dashed line represents the underrepresented group identified on the right margin; a solid line represents the relevant comparison group (e.g., men in the top panel). “Drop” indicates students who took GenChem 1 but did not reappear in the dataset over the study period. “Retake” indicates students who took GenChem 1 again. “Persist” indicates students who took GenChem 2 during the study period. The estimates are from models that included SAT scores and high school GPA as covariates.
