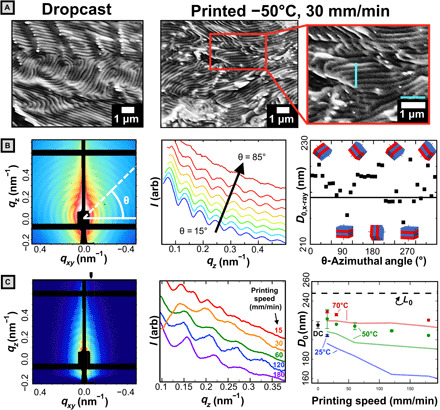
Fig. 4. Microstructural characterization.

(A) Representative cross-sectional SEM of dropcast and printed films with 1-μm scale and guidelines. (B) Left: 2D SAXS data for dropcast sample with sample azimuthal line-cut (white). Middle: 1D linecuts plotted for various azimuthal angles (θ). Right: d-spacing determined from the q interval between adjacent peaks. Solid black line reflects azimuthally averaged data. (C) Left: 2D SAXS data for a sample printed at 50°C and 120 mm/min. The black tick mark indicates the region integrated for 1D profiles. Middle: 1D SAXS profiles for samples printed at 50°C. Deviation at low q (orange curve) caused by positioning the integrating region at an offset from qxy = 0 to avoid diffuse background intensity. Right: Domain d-spacing calculated from SAXS (solid points) versus printing speed. Error bars on colored points represent the range of two scans. Error bars for dropcast (DC) sample represent the SD of nine measurements across three samples. The dashed line represents the contour length of the bottlebrush estimated with a fixed backbone contour length of 0.62 nm per norbornene repeat unit. Faded lines connect the domain size estimates obtained by application of the Bragg-Snell law to optical peaks reported in Fig. 3.
