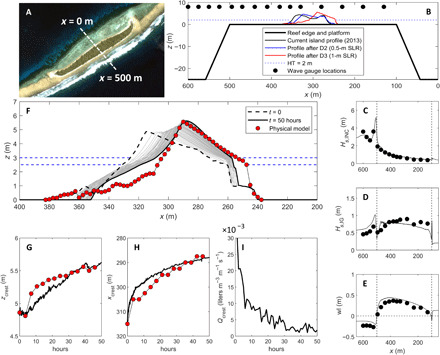
Fig. 1. Reef island response to SLR.

(A) Aerial photograph of Fatato, Funafuti atoll, Tuvalu; white dashed line indicates central profile line. (B) Experimental setup in the physical and numerical model. (C to E) Physical model data (black circles) and numerical model results (black line) of (C) incident significant wave height Hs,INC, (D) infragravity significant wave height Hs,IG, and (E) mean water level wl for a run with Hs = 4 m, Tp = 9.9 s, and hreef = 1 m. Vertical black dashed lines represent the reef platform edge. (F) Measured and modeled reef island morphology after 50 hours (Hs = 4 m and Tp = 9.9 s in the numerical model; representing 7 hours, Hs = 0.08 m, and Tp = 1.3 s in the physical model) with sea level raised from hreef = 2.5 m to hreef = 3 m for the optimal combination of the relevant model parameters (D50 = 14 mm; K = 0.005 m s−1; ϕ = 25o). (G to I) Measured (red circles) and modeled (black line) time series of (G) island crest elevation zcrest, (H) island crest position xcrest, and (I) overwash discharge Qcrest. The 1:50 scale physical experiment results are plotted at the prototype scale.
