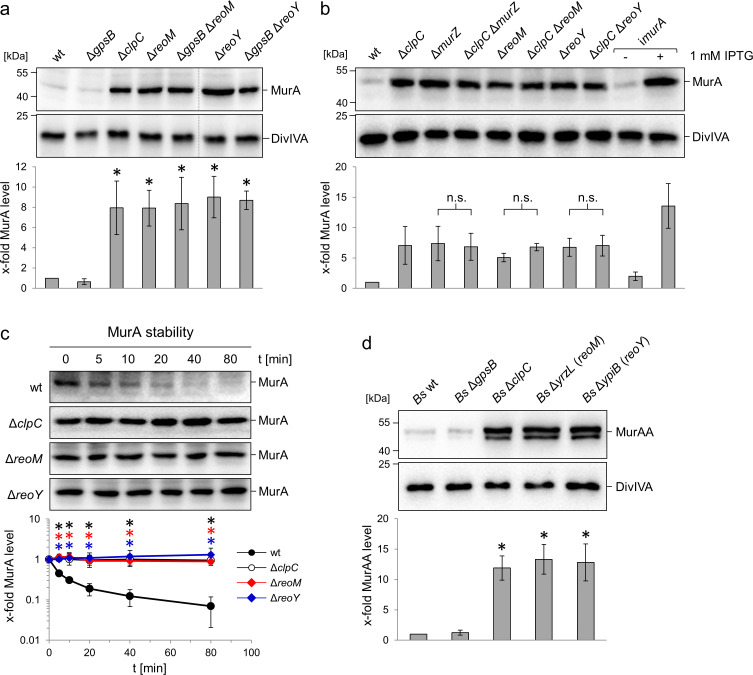
Figure 2. Effect of the reoM, reoY and clpC genes on levels of MurA in L. monocytogenes and MurAA in B. subtilis.
(A) Effect of reoM and reoY deletions (single or when combined with gpsB deletion) on MurA (above) and DivIVA levels (middle) in L. monocytogenes strains EGD-e (wt), LMJR19 (ΔgpsB), LMSW30 (ΔreoM), LMSW32 (ΔreoY), LMJR137 (ΔgpsB ΔreoM) and LMJR120 (ΔgpsB ΔreoY) and quantification of MurA levels (below). Strain LMJR138 (ΔclpC) was included for comparison. Non-relevant lanes were excised from the blots (dotted lines). Average values ± standard deviations were shown (n = 3). Statistically significant differences compared to wild type are marked by asterisks (p<0.05, t-test). (B) Effect of reoM, reoY and murZ deletions when combined with clpC deletion on MurA (above) and DivIVA levels (middle) in L. monocytogenes strains EGD-e (wt), LMJR138 (ΔclpC), LMJR104 (∆murZ), LMJR171 (ΔclpC ΔmurZ), LMSW30 (ΔreoM), LMSW50 (ΔclpC ΔreoM), LMSW32 (ΔreoY) and LMSW51 (ΔclpC ΔreoY) and quantification of MurA levels (below). Strain LMJR123 (imurA, i - is used to denote IPTG-dependent alleles) grown in the presence or absence of IPTG was included for comparison. Average values and standard deviations were shown (n = 3) and n. s. means not significant (p<0.05, t-test). (C) Western blots following MurA degradation in vivo. L. monocytogenes strains EGD-e (wt), LMJR138 (ΔclpC), LMSW30 (ΔreoM) and LMSW32 (ΔreoY) were grown to an OD600 of 1.0 and 100 µg/ml chloramphenicol was added. Samples were taken before chloramphenicol addition and after several time intervals to analyse MurA levels. MurA signals were quantified by densitometry and average values and standard deviations are shown (n = 3). Statistically significant differences are marked with asterisks (p<0.05, t-test). (D) Effect of the reoM and reoY homologues yrzL and ypiB, respectively, on MurAA (above) and DivIVA levels (middle) of B. subtilis and quantification of MurAA levels (below). Strains BKE00860 (ΔclpC), BKE22180 (ΔgpsB), BKE22580 (ΔypiB/reoY) and BKE27400 (ΔyrzL/reoM) were grown to mid-logarithmic growth phase before total cellular proteins were isolated. B. subtilis 168 (wt) was included as control. That MurAA is detected in two isoforms had been observed earlier but the reasons for this are not known (Kock et al., 2004). Average values and standard deviations were shown (n = 3). Asterisks indicate statistically significant differences compared to wild type (p<0.05, t-test).
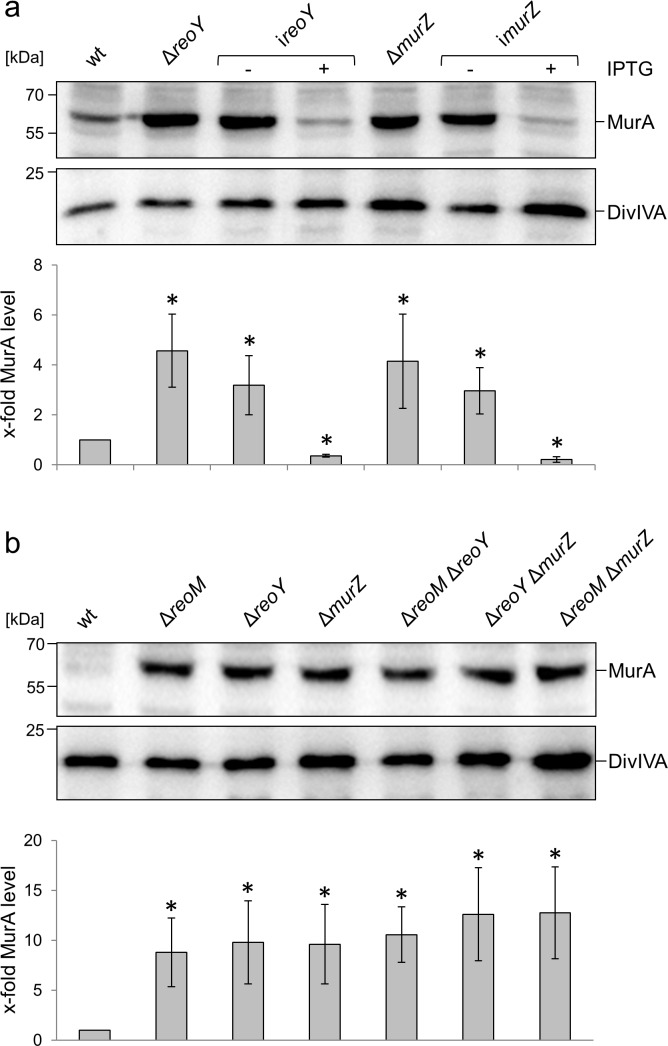
Figure 2—figure supplement 1. Complementation and epistasis experiments.
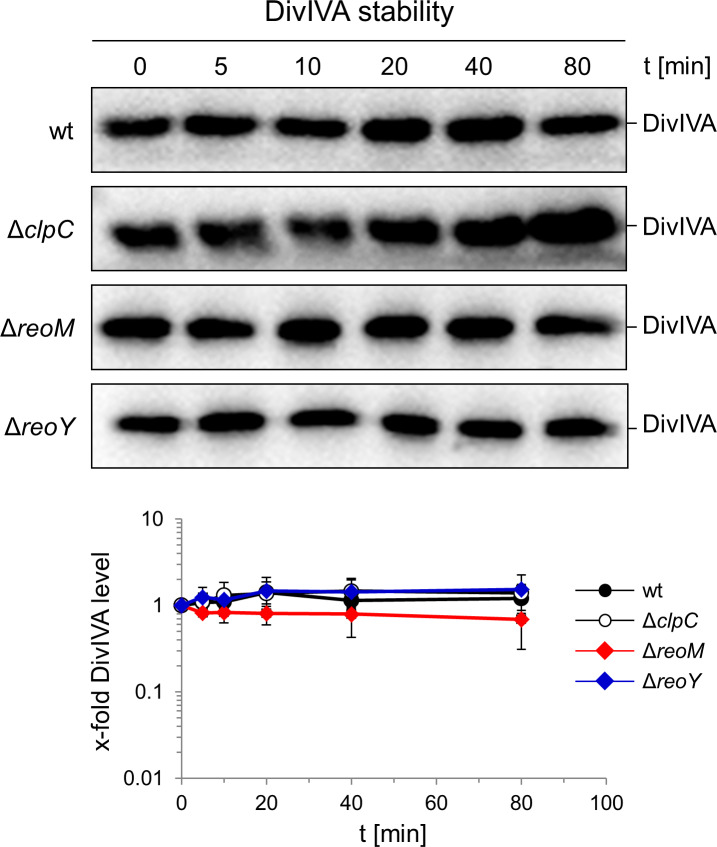
Figure 2—figure supplement 2. DivIVA stability in L. monocytogenes ΔclpC, ΔreoM and ΔreoY mutants.
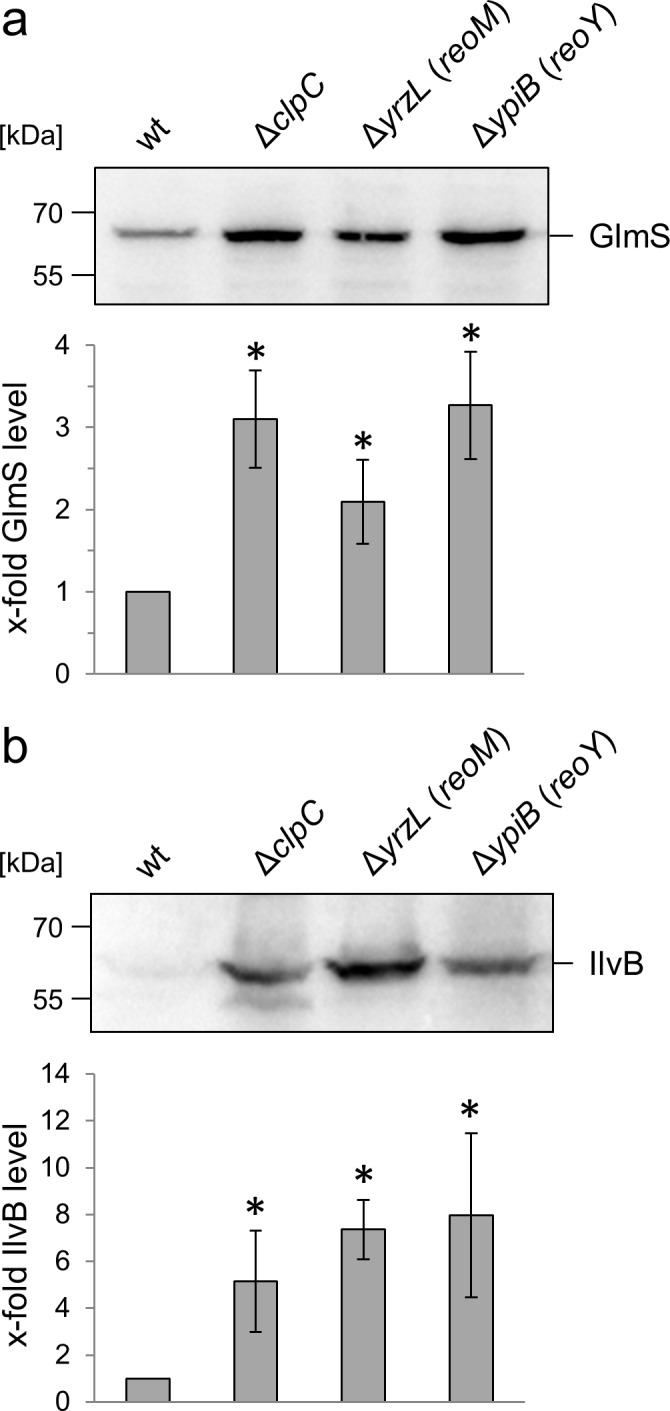
Figure 2—figure supplement 3. Effect of reoM and reoY deletions on accumulation of other ClpC substrates in B. subtilis.


