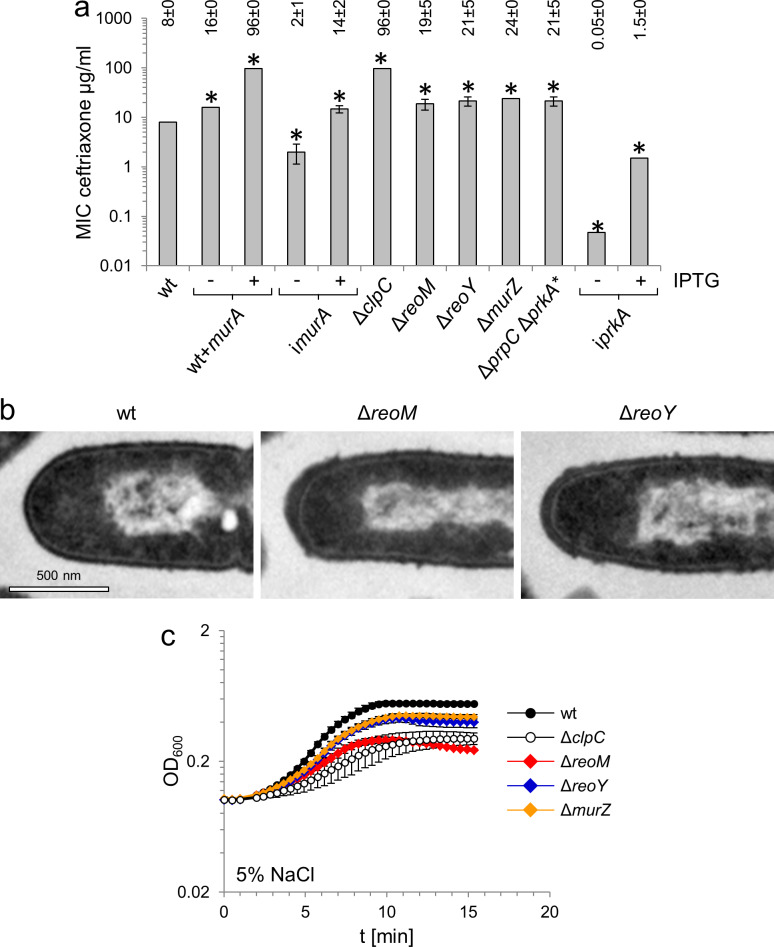
Figure 3. MurA accumulation affects peptidoglycan biosynthesis and salt sensitivity.
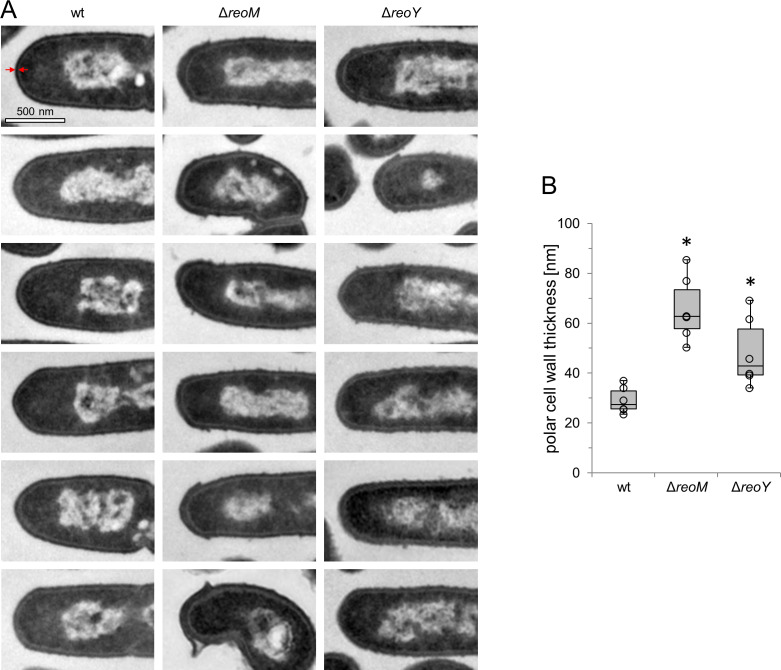
(A) Minimal inhibitory concentrations (MIC) for ceftriaxone of mutants with altered MurA accumulation. Average values and standard deviations are calculated from three independent experiments and given above the panel. Asterisks indicate statistically significant differences compared to wild type (p<0.05, t-test). Please note that the iprkA strain showed residual growth on BHI agar plates not containing IPTG, even though it required IPTG for growth in BHI broth. (B) Transmission electron microscopy of ultrathin sections of fixed whole cells of L. monocytogenes wildtype, ΔreoM and ΔreoY mutants. L. monocytogenes strains EGD-e (wt), LMSW30 (ΔreoM) and LMSW32 (ΔreoY) were grown to mid-logarithmic growth phase in BHI broth at 37°C and subjected to chemical fixation and subsequent electron microscopy as described in the experimental procedures section. (C) Salt sensitive growth of mutants with altered MurA accumulation. L. monocytogenes strains EGD-e (wt), LMJR138 (ΔclpC), LMSW30 (ΔreoM), LMSW32 (ΔreoY) and LMJR104 (∆murZ) were grown in BHI broth containing 5% NaCl at 37°C. Average values and standard deviations are calculated from three independent experiments.


