. 2020 Jun 10;9:e55143. doi: 10.7554/eLife.55143

Figure 2. The target-strand cleavage site becomes distorted upon R-loop formation.

(A) Denaturing PAGE phosphorimages of piperidine-treated permanganate oxidation products, demonstrating the assay’s ability to detect non-B-form DNA conformations within and adjacent to a dCas12a-generated R-loop. Permanganate reactions were quenched after 10 s at 30°C. Each thymine in the DNA substrate is shown as a circled T. (B) Permanganate reactivity of a PAM-distal R-loop flank whose sequence was changed (as compared to the native protospacer sequence that was probed in A) to contain more thymines, with an intact or cleaved non-target strand (‘cleaved NTS’ indicates that there is a 5-nt gap in the NTS—see Appendix 2). Permanganate reactions were quenched after 2 min at 30°C. A raw phosphorimage is shown in Figure 2—figure supplement 3. The permanganate reactivity index (PRI) is an estimate of the rate of oxidation at each thymine, normalized such that PRI = 1 for a fully single-stranded thymine (see Materials and methods). Columns and associated error bars indicate the mean and standard deviation of three replicates. The phosphodiester bonds normally cleaved by WT Cas12a are indicated with arrows on the substrate schematic for reference, but note that the complexes being probed with permanganate were formed with dCas12a.

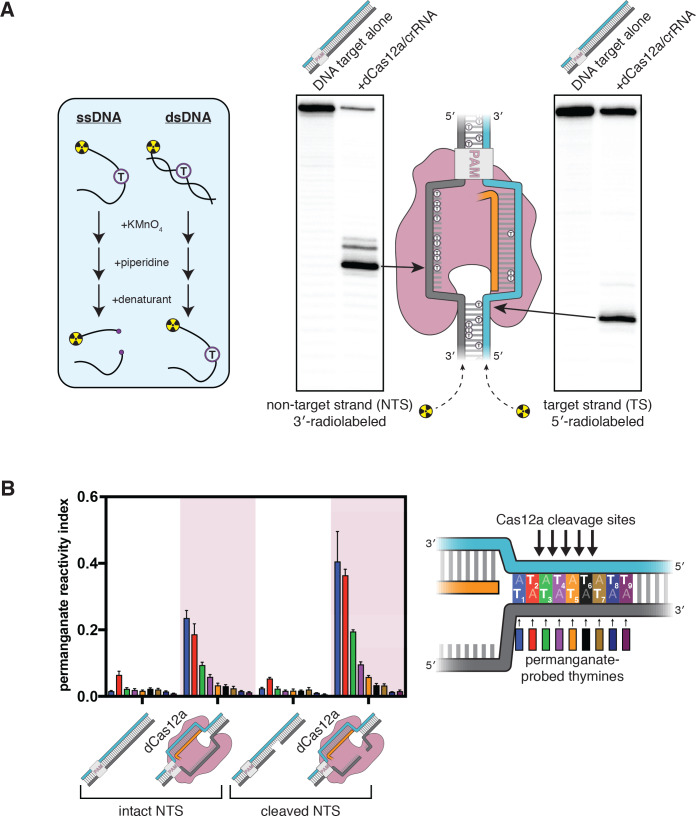
Figure 2—source data 1. Numerical data plotted in Figure 2 and accompanying figure supplements.

Figure 2.

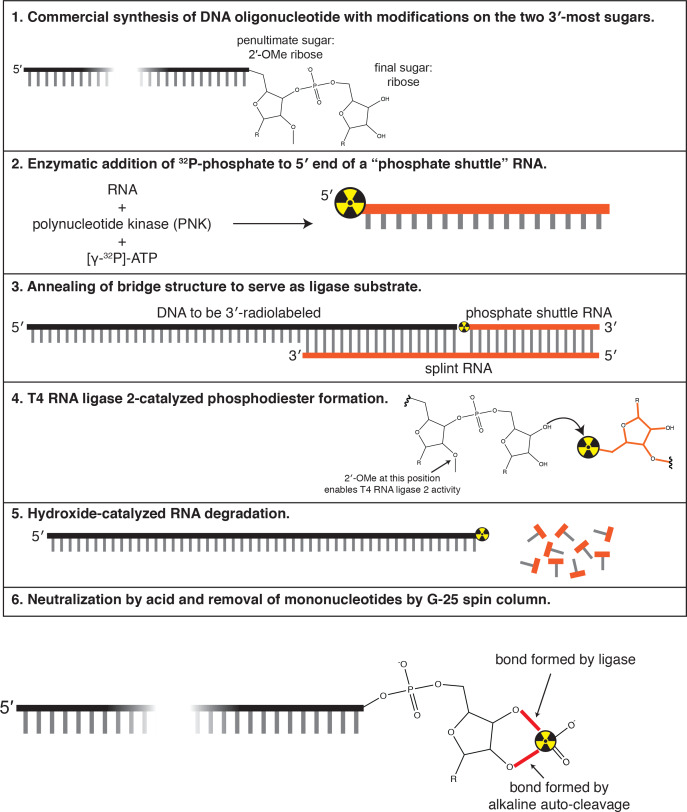
Figure 2—figure supplement 1. Method used to 3′-end radiolabel DNA oligonucleotides.

Figure 2—figure supplement 1.

See Materials and methods for details.
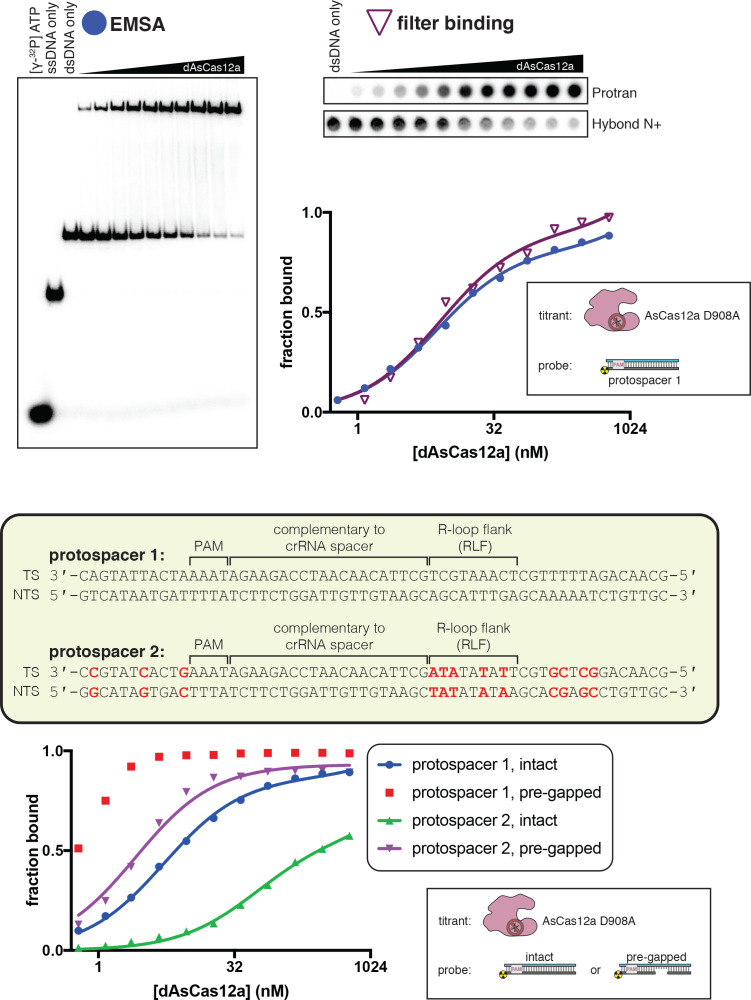
Figure 2—figure supplement 2. A gap in the non-target strand increases the affinity of dCas12a for its DNA target.

Figure 2—figure supplement 2.

Top panel: The affinity of dAsCas12a/crRNA for a cognate DNA target was assessed by an electrophoretic mobility shift assay (EMSA) and a filter-binding (FB) assay. dAsCas12a was titrated in a solution with fixed [crRNA] (750 nM) and [DNA probe] (100 pM), followed by separation of protein-bound DNA from free DNA. The EMSA indicated that the oligonucleotide annealing protocol yields 100% duplex DNA probe and that the binding conditions yield one major protein-bound species. ‘Fraction bound’ is defined as (background-subtracted volume of upper band)/(total background-subtracted lane volume) for the EMSA and (background-subtracted volume of Protran spot)/(total background-subtracted volume of Protran spot + Hybond N+ spot) for the filter-binding assay. The value of ‘fraction bound’ was 0 at [dAsCas12a]=0 for both assays (not shown in plot due to the logarithmic x-axis). When appropriate, data were fit to the sum of a hyperbola and a line (y = Bmax*x/(KD+x)+NS*x), where NS describes a non-specific binding mode. It is common to see Bmax values below 1 in EMSAs and filter-binding assays, in which the process of physical separation can disrupt bound species. KD for the EMSA was 8.2 nM (n = 1). KD for the filter-binding assay was 8.1 nM ±0.8 (SD) (n = 3). Bottom panel: Using the filter binding assay, we assessed the affinity of dAsCas12a/crRNA for various cognate DNA targets. Protospacer 2 (used in Figure 2B) is the version of protospacer 1 (used in Figure 2A) modified for permanganate probing of the R-loop flank. Differences between protospacer 1 and protospacer 2 are highlighted in red (A/T base pairs substituted into the R-loop flank, G/C base pairs substituted elsewhere to maintain stable association between the two DNA strands). ‘Intact’ protospacers are as shown in the sequence schematic. ‘Pre-gapped’ protospacers are missing nt 14–18 of the NTS (as measured from the PAM, see Appendix 2). The value of ‘fraction bound’ was 0 at [dAsCas12a]=0 for all substrates (not shown due to the logarithmic x-axis). Data were analyzed as described for the top panel. KD for protospacer 1 (intact) was 5 nM ±1 (SD) (n = 3). KD for protospacer 2 (intact) was 54 nM ±12 (SD) (n = 3). KD for protospacer 2 (pre-gapped) was 2.8 nM ±0.5 (SD) (n = 3). Data from the protospacer 1 (pre-gapped) experiment indicated that the KD was near or below [DNA probe], preventing accurate KD determination by hyperbolic fitting. The reason for the low observed affinity of dAsCas12a for protospacer 2 (intact) is unknown.
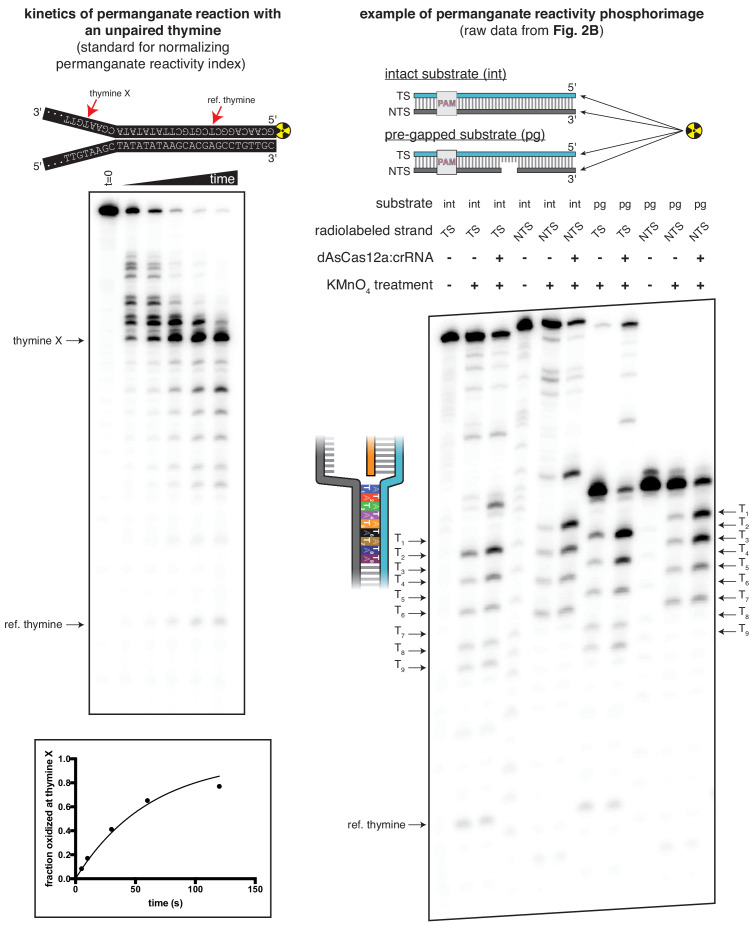
Figure 2—figure supplement 3. Translating raw phosphorimages into quantitative permanganate reactivity metrics.

Figure 2—figure supplement 3.

Left panel: Kinetics of permanganate reaction with an unpaired thymine. The depicted substrate was subject to the standard permanganate reaction protocol with quenching at 0, 5, 10, 30, 60, and 120 seconds. Black arrows indicate chemical cleavage fragments that resulted from oxidation of the annotated thymine. ‘Fraction oxidized at thymine X,’ plotted in the graph at the bottom, was determined as described in Materials and methods and is equivalent to the variable pi. The phosphorimage and graph shown are from a single representative replicate (n = 3). Data were fit to an exponential decay (y = (y0-plateau)*exp(-k*x)+plateau), with y0 constrained to 0 and the plateau value constrained to 1. The value of k was determined to be 0.998 min−1 ±0.027 (SD) (n = 3), which, when corrected to the reference thymine, yielded the value of kss,corr=0.79 min−1 that was used for normalization of the permanganate reactivity index in all other permanganate experiments. Right panel: Raw phosphorimage of quantified data presented in Figure 2B. Black arrows indicate chemical cleavage fragments that resulted from oxidation of the annotated thymine. The method to determine the 'permanganate reactivity index' and 'fraction oxidized' metrics from a raw phosphorimage is described in Materials and methods.