. 2020 Jun 10;9:e55143. doi: 10.7554/eLife.55143

Figure 3. DNA distortion in the R-loop flank facilitates target-strand cleavage.

(A) Permanganate reactivity of A/T tract in a 20-nt R-loop and an 18-nt R-loop. Permanganate experiments were conducted as in Figure 2B (2 minutes, 30°C). Purple rectangles alongside DNA schematics indicate the location of the tract of DNA whose permanganate reactivity is being quantified. The y-axis denotes the fraction of DNA molecules estimated to have been oxidized on at least one thymine within the A/T tract (see Materials and methods). Columns and associated error bars indicate the mean and standard deviation of three replicates. (B) Target-strand cut-site distribution with a shrinking R-loop, as resolved by denaturing PAGE and phosphorimaging (n = 3). 100 nM AsCas12a and 120 nM crRNA were incubated with 1 nM of DNA target at 37°C for 1 hr, prior to quenching and resolution by denaturing PAGE (kinetics shown in Figure 3—figure supplement 4). Each lane corresponds to a different DNA target, bearing varying numbers of PAM-distal mismatches with respect to the crRNA. Indicated above each lane is the number of base pairs of complementarity between the target strand and the crRNA spacer, starting with the base immediately adjacent to the PAM. For the lane lacking an asterisk, the DNA target was fully duplex. For the lanes that bear asterisks, the DNA target contained a bubble across the region of crRNA:TS complementarity, which stabilized the interaction of the DNA with the Cas12a/crRNA complex. Numbers to the left of the phosphorimage indicate the position (distance from the PAM, as numbered in C) of the dinucleotide whose phosphodiester was cleaved to yield the labeled band. Black arrows are drawn on the substrate diagrams to indicate cleaved phosphodiesters (as determined from the phosphorimage), and relative arrow lengths are roughly reflective of relative band intensities. (C) Target-strand cut-site distribution with various sequences in the R-loop flank (all with a 20-nt R-loop), as resolved by denaturing PAGE and phosphorimaging (n = 3). 100 nM AsCas12a and 120 nM crRNA were incubated with 1 nM of DNA target at 25°C for 10 min, prior to quenching and resolution by denaturing PAGE (kinetics shown in Figure 3—figure supplement 7). All DNA targets were 5'-radiolabeled on the target strand. The non-target strand contained a gap from positions 14–18 (see Appendix 2) but was complementary to the target strand at positions 1–13 and 19–20. In each lane, the DNA target was varied to contain different sequences in the R-loop flank, which either formed a perfect duplex (substrates A, C, and E) or contained a 3-bp NTS:TS mismatch (substrates B, D, and F). Black arrows are drawn on the substrate diagrams as in B.

Figure 3—source data 1. Numerical data plotted in Figure 3 and accompanying figure supplements.

Figure 3.

Figure 3—figure supplement 1. dCas12a ribonucleoprotein binds tightly to pre-gapped/pre-unwound targets despite PAM-distal mismatches.

Figure 3—figure supplement 1.

The affinity of dAsCas12a/crRNA for various cognate DNA targets was assessed by a filter-binding assay. ‘Pre-gapped’ indicates the presence of a 5-nt gap in the non-target strand (see Appendix 2). ‘Pre-unwound’ indicates the presence of a stretch of NTS:TS mismatches in the DNA substrate. In Figure 3A, protospacer 3 is annotated as ‘DNA substrate 1;’ protospacer 4 is annotated as ‘DNA substrate 2;’ and crRNA 3 is the depicted crRNA. For each combination of crRNA/DNA target, crRNA was titrated in a solution with fixed [dAsCas12a] (400 nM), [DNA probe] (100 pM), and [non-specific DNA competitor] (500 nM). The identities of the titrant/fixed component were inverted in this experiment (as compared to all other binding experiments) because crRNA can form a stable complex with pre-unwound DNA targets in the absence of protein. Keeping [dAsCas12a] at 400 nM favored the formation of (dAsCas12a/crRNA):DNA complexes over crRNA:DNA complexes (which would be indistinguishable from free DNA in the filter binding assay). In the presence of high [apo protein], 500 nM non-specific DNA competitor (a duplex with a short ssDNA overhang) was also included to disfavor non-specific interactions between radiolabeled DNA and apo protein. The value of ‘fraction bound’ was 0 at [crRNA]=0 for all substrates (not shown due to the logarithmic x-axis). For all pre-unwound DNA targets, the fraction bound was essentially concentration-independent across all nonzero concentrations tested, suggesting that the lowest concentration tested had already saturated the specific binding interaction being probed. The high stability is in line with thermodynamic expectations for an interaction involving hybridization of two complementary 18-nt or 20-nt oligonucleotides (Tm > 40°C) (Kibbe, 2007). The fact that the saturated bound fraction is less than 1 could be due to (1) a common feature of filter-binding assays in which the process of physical separation disrupts bound species or (2) a stable population of protein-free crRNA:DNA complexes. In any case, the important conclusion to be drawn from these data is that each protospacer exhibits the same fraction bound regardless of the presence of mismatches at positions 19 and 20 in the crRNA. Thus, the crRNA-dependent effects seen in Figure 3A and Figure 3—figure supplement 2 must emerge from fundamental differences in conformational dynamics and not from differences in binding occupancy of Cas12a/crRNA on the DNA probe.
Figure 3—figure supplement 2. Effect of R-loop truncation on permanganate reactivity of the A/T tract.

Figure 3—figure supplement 2.

Permanganate reactivity of the A/T tract in a 20-nt R-loop and an 18-nt R-loop. In Figure 3A, protospacer 3 is annotated as ‘DNA substrate 1;’ protospacer 4 is annotated as ‘DNA substrate 2;’ and crRNA 3 is the depicted crRNA. Permanganate experiments were conducted as in Figure 2B (2 minutes, 30°C). See Materials and methods for description of the parameters plotted on the y-axis. Columns and associated error bars indicate the mean and standard deviation of three replicates. Columns 1, 2, 4, and 6 are equivalent to the data shown in Figure 3A. Columns 3 and 5 use a crRNA with compensatory mutations at positions 19–20, showing that the effect is dependent upon base pairing topology and not a particular sequence.
Figure 3—figure supplement 3. Effect of PAM-distal mismatches on non-target-strand and target-strand cleavage kinetics and position with fully duplex DNA targets.

Figure 3—figure supplement 3.

100 nM AsCas12a and 120 nM crRNA were incubated with 1 nM of DNA target at 37°C for 20 s, 1 min, 5 min, and 30 min, prior to quenching and resolution by denaturing PAGE. Each group of four lanes corresponds to a different DNA target, with varying numbers of PAM-distal mismatches with respect to the crRNA. Indicated above each group of four lanes is the number of base pairs of complementarity between the TS and the crRNA spacer, starting with the base immediately adjacent to the PAM. All DNA targets in this gel were fully duplex (not pre-unwound/bubbled), resulting in enhanced discrimination against PAM-distal mismatches as compared to the bubbled DNA targets in Figure 3B and Figure 3—figure supplement 4.
Figure 3—figure supplement 4. Effect of PAM-distal mismatches on non-target-strand and target-strand cleavage kinetics and position with bubbled DNA targets.

Figure 3—figure supplement 4.

100 nM AsCas12a and 120 nM crRNA were incubated with 1 nM of DNA target at 37°C for 0 s, 15 s, 2 min, 10 min, and 1 hr, prior to quenching and resolution by denaturing PAGE. Each time series corresponds to a different DNA target, bearing varying numbers of PAM-distal mismatches with respect to the crRNA. Indicated above each time series is the number of base pairs of complementarity between the TS and the crRNA spacer, starting with the base immediately adjacent to the PAM. For the time series lacking an asterisk, the DNA target was fully duplex (as in Figure 3—figure supplement 3). For the time series that bear asterisks, the DNA target contained a bubble across the region of crRNA:TS complementarity (as illustrated in Figure 3B), which stabilized the R-loop. In the top panel, the NTS was 5'-radiolabeled. In the bottom panel, the TS was 5'-radiolabeled.
Figure 3—figure supplement 5. Determinants of altered target-strand cleavage kinetics and position.

Figure 3—figure supplement 5.

100 nM AsCas12a and 120 nM crRNA were incubated with 1 nM duplex DNA target radiolabeled on the 5' end of the target strand at 37°C for 0 s, 15 s, 1 min, 4 min, 15 min, or 1 hr, prior to quenching and resolution by denaturing PAGE. The 20-nt target sequence immediately adjacent to the PAM is shown below the crRNA spacer sequence used in each experiment. Red letters indicate TS:crRNA mismatches. Green letters indicate compensatory changes in the crRNA to restore a 20-nt match. The final timepoint of each reaction is reproduced in the gel on the right, for side-by-side comparison of the cleavage site distributions. ‘Fraction cleaved’ is defined as (sum of the volume of all bands below the uncleaved band)/(total volume in lane). Data were fit to an exponential decay (y = (y0-plateau)*exp(-k*x)+plateau), with y0 constrained to 0 and the plateau value constrained to ≤1. A representative replicate is shown. The value of kobs for each time course is as follows: A (0.12 s−1), B (0.0093 s−1), C (0.0094 s−1), D (0.16 s−1), E (0.015 s−1). The precise value of kobs for A and D should be interpreted with caution due to poor sampling of informative timepoints.
Figure 3—figure supplement 6. Non-target-strand cut-site distribution with a shrinking R-loop.

Figure 3—figure supplement 6.

Final timepoint (1 hr) of each time series in the non-target-strand gel shown in the top panel of Figure 3—figure supplement 4, shown side-by-side for visual comparison—analogous to the final timepoints for the target strand shown in Figure 3B.
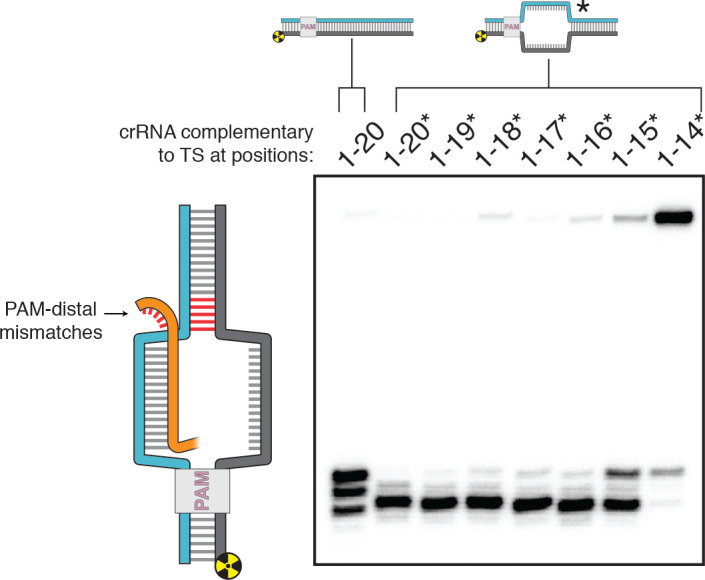
Figure 3—figure supplement 7. Kinetics of target-strand cleavage in DNA targets with various sequences in the R-loop flank.

Figure 3—figure supplement 7.

Experiment performed as described in legend to Figure 3C. 100 nM AsCas12a and 120 nM crRNA were incubated with 1 nM of DNA target at 25°C for 0 s, 15 s, 30 s, 1 min, 2 min, 4 min, or 10 min, prior to quenching and resolution by denaturing PAGE. All DNA targets were 5'-radiolabeled on the TS. The NTS was pre-gapped from positions 14–18 but complementary to the TS at positions 1–13 and 19–20. In each lane, the DNA target was varied to contain different sequences in the R-loop flank, which either formed a perfect duplex (substrates A, C, and E) or contained a 3-bp NTS:TS mismatch (substrates B, D, and F). ‘Fraction cleaved’ is defined as (sum of the volume of all bands below the uncleaved band)/(total volume in lane). Data were fit to an exponential decay (y=(y0-plateau)*exp(-k*x)+plateau), with y0 constrained to 0. A representative replicate (n = 3) is shown. The value of kobs ± SD for each time course is as follows: A [0.092 ± 0.012 s−1], B [0.145 ± 0.007 s−1], C [0.0059 ± 0.0006 s−1], D [0.137 ± 0.002 s−1], E [0.024 ± 0.002 s−1], F [0.061 ± 0.013 s−1]. The rate constants for B and D should be interpreted with caution due to poor sampling of informative timepoints.