. 2020 Jun 10;9:e55143. doi: 10.7554/eLife.55143

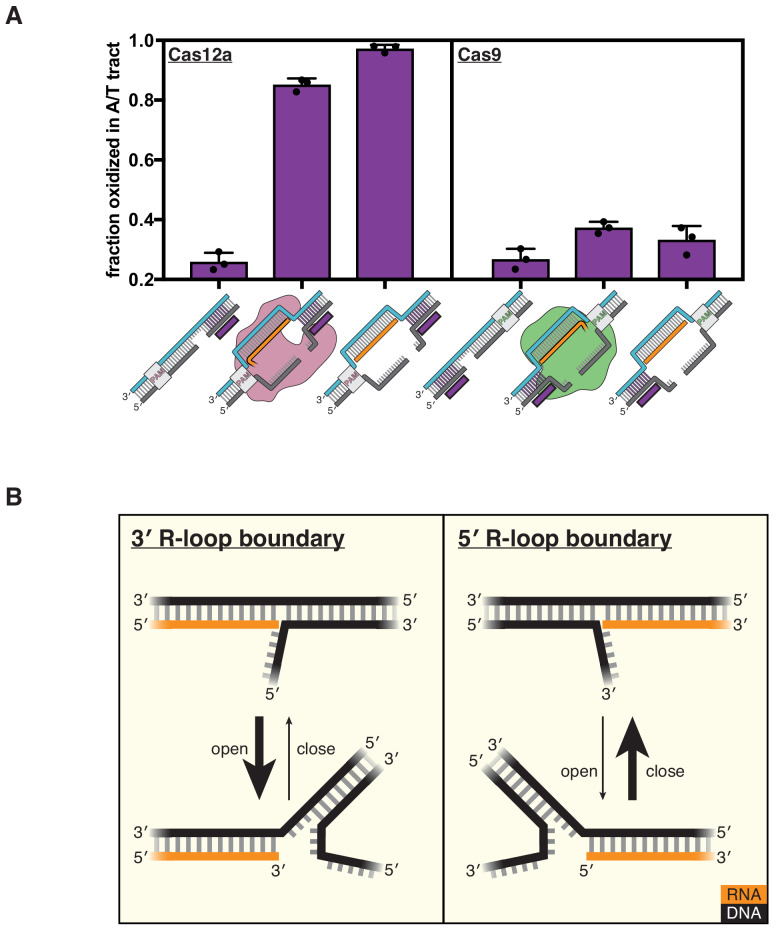
Figure 4. DNA distortion is protein-independent and unique to 3' R-loop flanks.

(A) Permanganate reactivity of the A/T tract in a dCas12a R-loop, a dCas9 R-loop, and their protein-free mimics. The y-axis denotes the fraction of DNA molecules estimated to have been oxidized on at least one thymine within the A/T tract (see Materials and methods). Purple rectangles alongside DNA schematics indicate the location of the tract of DNA whose permanganate reactivity is being quantified. Columns and associated error bars indicate the mean and standard deviation of three replicates. (B) Model for the relative conformational dynamics of 3' and 5' R-loop boundaries, as suggested by permanganate reactivity experiments. The depth of fraying shown (three base pairs) was chosen arbitrarily for the schematic and should not be interpreted as a uniquely stable ‘open’ structure (see Materials and methods).

Figure 4—source data 1. Numerical data plotted in Figure 4 and accompanying figure supplements.

Figure 4.

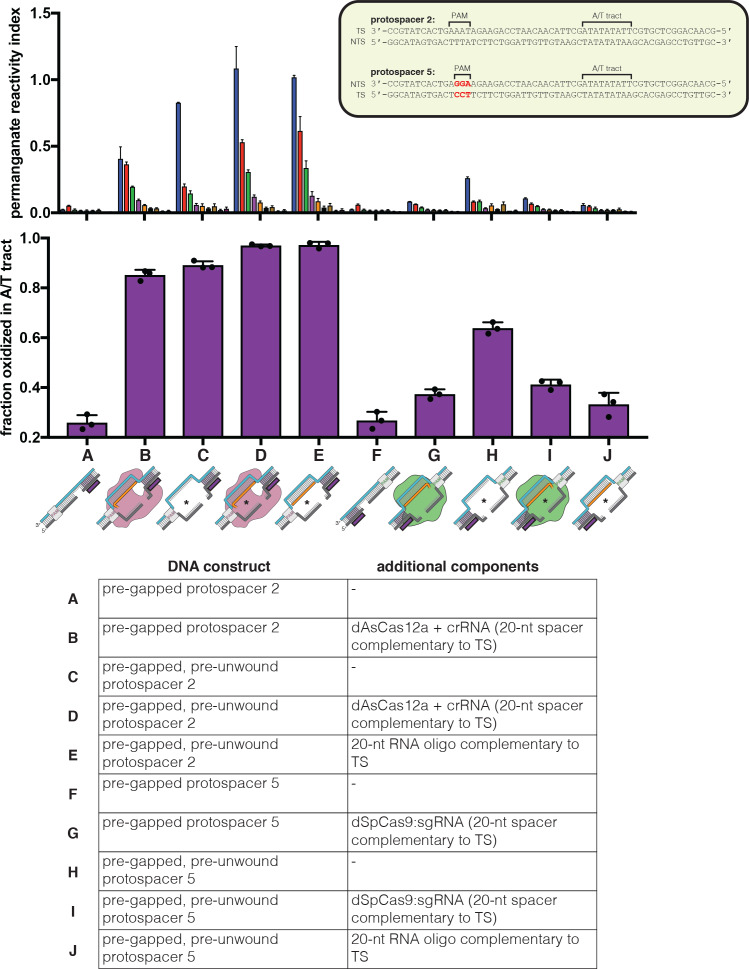
Figure 4—figure supplement 1. Permanganate reactivity of the A/T tract in R-loops formed by dCas12a or dCas9.

Figure 4—figure supplement 1.

Permanganate experiments were conducted as in Figure 2B (2 minutes, 30°C). ‘Pre-gapped’ indicates the presence of a 5-nt gap in the non-target strand (see Appendix 2) (the NTS gap in the dCas9 target is unrelated to the cut that would normally be formed by a nuclease-active Cas9—instead, it was designed to be analogous to the NTS gap formed by AsCas12a in an R-loop of the opposite topology, at positions 14–18). ‘Pre-unwound’ indicates the presence of a stretch of NTS:TS mismatches in the DNA substrate (20-nt bubble throughout the region of RNA complementarity); asterisks highlight the constructs that contain these NTS:TS mismatches. The sequence of protospacer 5 is identical to that of protospacer 2 except for a change in the PAM, which is not expected to affect conformational dynamics at the A/T tract (besides in permitting dCas9 binding). See Materials and methods for description of the parameters plotted on the y-axis. Columns and associated error bars indicate the mean and standard deviation of three replicates. Experiments A, B, E, F, G, and J are equivalent to the data shown in Figure 4A.
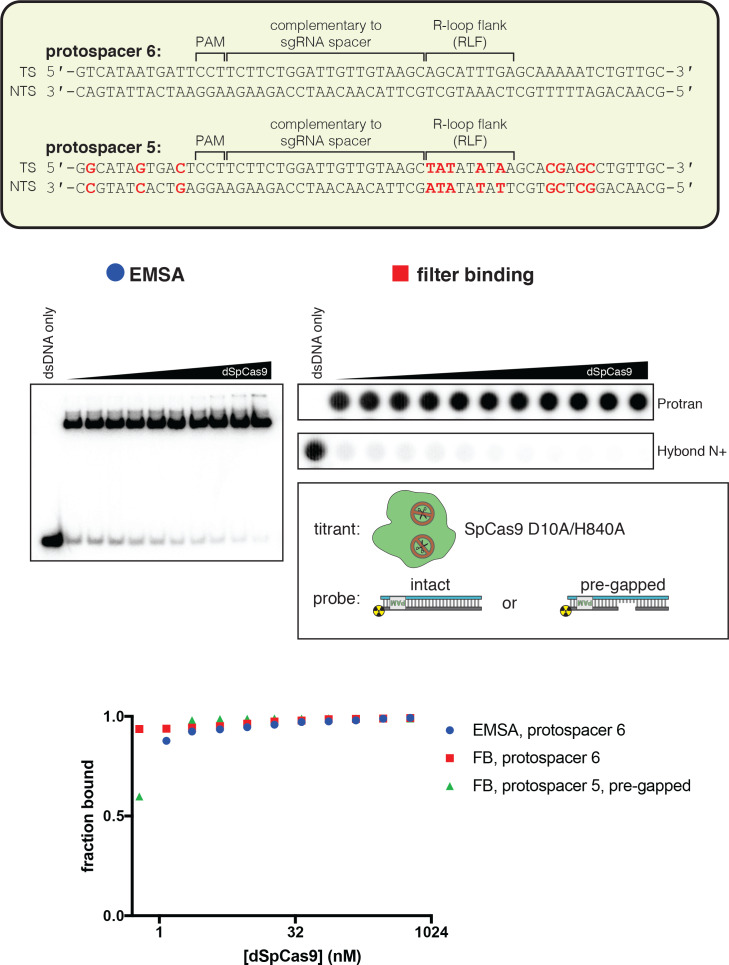
Figure 4—figure supplement 2. dCas9 binds tightly to pre-gapped DNA targets.

Figure 4—figure supplement 2.

The affinity of dSpCas9/sgRNA for a cognate DNA target was assessed by an electrophoretic mobility shift assay (EMSA) and a filter-binding (FB) assay. dSpCas9 was titrated in a solution with fixed [sgRNA] (750 nM) and [DNA probe] (100 pM), followed by separation of protein-bound DNA from free DNA. The EMSA indicated that the binding conditions yield one major protein-bound species. ‘Fraction bound’ is defined as (background-subtracted volume of upper band)/(total background-subtracted lane volume) for the EMSA and (background-subtracted volume of Protran spot)/(total background-subtracted volume of Protran spot + Hybond N+ spot) for the filter-binding assay. The value of ‘fraction bound’ was 0 at [dSpCas9]=0 for both substrates and both assays (not shown on plot due to the logarithmic x-axis). All data shown are from one representative replicate (n = 1 for EMSA, n = 3 for FB). Protospacer 6 is identical to protospacer 1 (used for AsCas12a), except the PAM has been substituted with a SpCas9 PAM. Protospacer 5 is a modified version of protospacer 6, with differences highlighted in red (equivalent to the protospacer-1-to-protospacer-2 modifications). The ‘intact’ protospacer is as shown in the sequence schematic. The ‘pre-gapped’ protospacer is missing nt 14–18 of the NTS (as measured from the PAM). The NTS gap is unrelated to the cut that would normally be formed by a nuclease-active Cas9—instead, it was designed to be analogous to the NTS gap formed by AsCas12a in an R-loop of the opposite topology, at positions 14–18. This DNA substrate binds tightly to dSpCas9. Thus, the failure of dSpCas9 to significantly distort the R-loop flank in Figure 4A is due to a fundamental difference in conformational dynamics and not to a failure to bind.
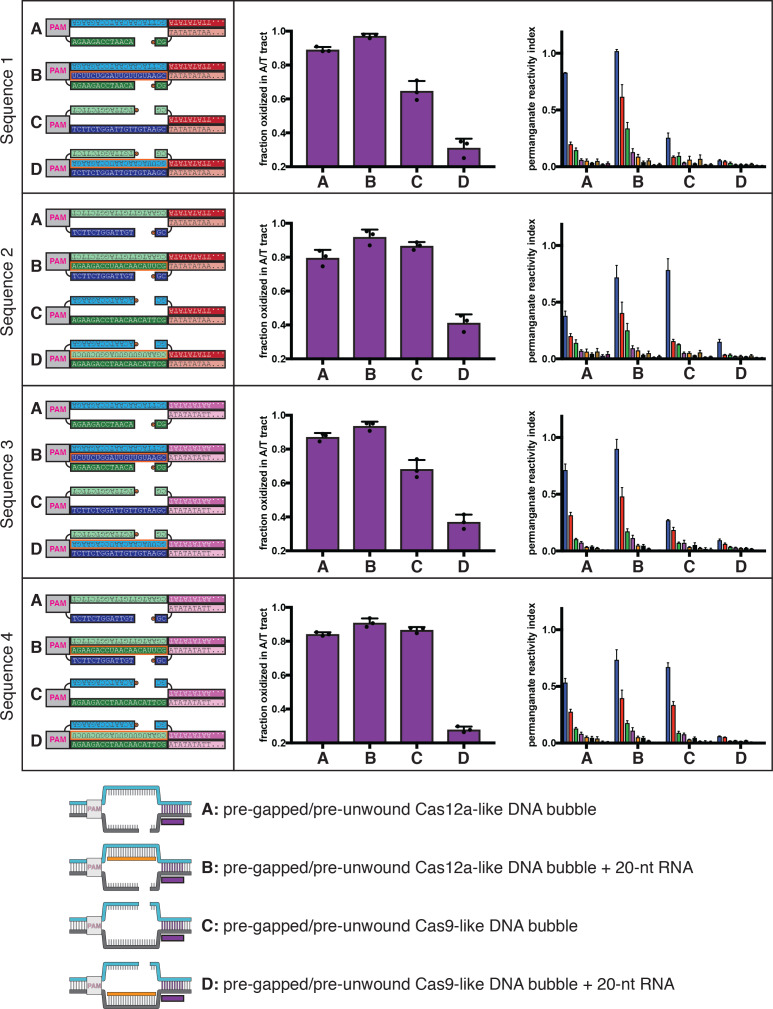
Figure 4—figure supplement 3. Permanganate reactivity of the A/T tract in protein-free R-loops of various sequences.

Figure 4—figure supplement 3.

Permanganate experiments were conducted as in Figure 2B (2 minutes, 30°C). See Materials and methods for description of the parameters plotted on the y-axis. Columns and associated error bars indicate the mean and standard deviation of three replicates. In all schematics, RNA molecules are outlined in orange, and DNA molecules are outlined in black. Circled ‘P’ indicates a 5′-phosphate. All sequences, when read right-side up, go from 5′ on the left to 3′ on the right. The terms ‘Cas12a-like’ and ‘Cas9-like’ are descriptors only of each substrate’s R-loop topology (the end of the RNA next to the boundary of interest is a 3′ end or a 5′ end, respectively)—both kinds of substrates contain a Cas12a PAM and a Cas12a-like NTS gap. These results imply that the asymmetry in R-loop-flank stability is a fundamental feature of R-loop structure and not a peculiarity of the original tested sequence.
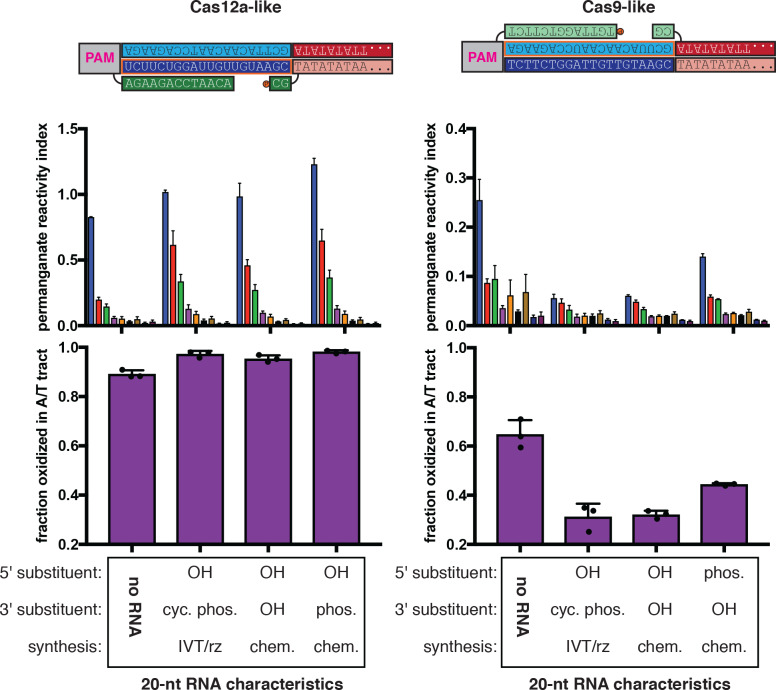
Figure 4—figure supplement 4. Effect of RNA end chemistry on permanganate reactivity of the A/T tract in protein-free R-loops.

Figure 4—figure supplement 4.

Permanganate experiments were conducted as in Figure 2B (2 minutes, 30°C), varying only the nature of the RNA molecule added to the pre-gapped/pre-unwound DNA substrate. See Materials and methods for description of the parameters plotted on the y-axis. Columns and associated error bars indicate the mean and standard deviation of three replicates. In both schematics, RNA molecules are outlined in orange, and DNA molecules are outlined in black. Circled ‘P’ indicates a 5′-phosphate. All sequences, when read right-side up, go from 5′ on the left to 3′ on the right. ‘OH’ indicates a hydroxyl. ‘Phos.’ indicates a phosphate. ‘Cyc. phos.’ indicates a 2′/3′-cyclic phosphate. ‘IVT/rz’ indicates that the RNA oligo was synthesized in an enzymatic in vitro transcription reaction, with ribozymes on both ends that cleaved to yield homogeneous termini. ‘Chem.’ indicates that the RNA oligo was chemically synthesized by a commercial source. The terms ‘Cas12a-like’ and ‘Cas9-like’ are descriptors only of each substrate’s R-loop topology (the end of the RNA next to the boundary of interest is a 3′ end or a 5′ end, respectively)—both kinds of substrates contain a Cas12a PAM and a Cas12a-like NTS gap.
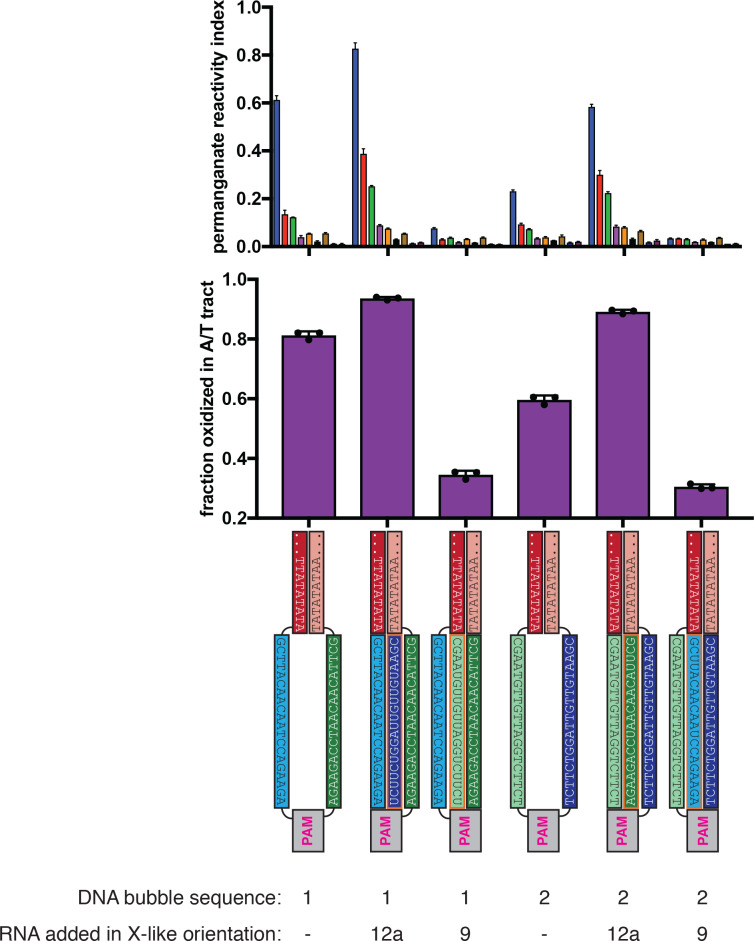
Figure 4—figure supplement 5. Asymmetry in R-loop flank stability is also a feature of intact R-loops.

Figure 4—figure supplement 5.

Permanganate experiments were conducted as in Figure 2B (2 minutes, 30°C). See Materials and methods for description of the parameters plotted on the y-axis. Columns and associated error bars indicate the mean and standard deviation of three replicates. In all schematics, RNA molecules are outlined in orange, and DNA molecules are outlined in black. All sequences, when read right-side up, go from 5′ on the left to 3′ on the right. These experiments provide the strongest point of comparison between the Cas12a-like and Cas9-like R-loop architecture, as the only component varied across conditions is which strand of an identical DNA bubble is hybridized to RNA (compare the cleaved R-loops, in which the position of the gap must be moved to the opposite strand, yielding slightly different baseline permanganate reactivity).
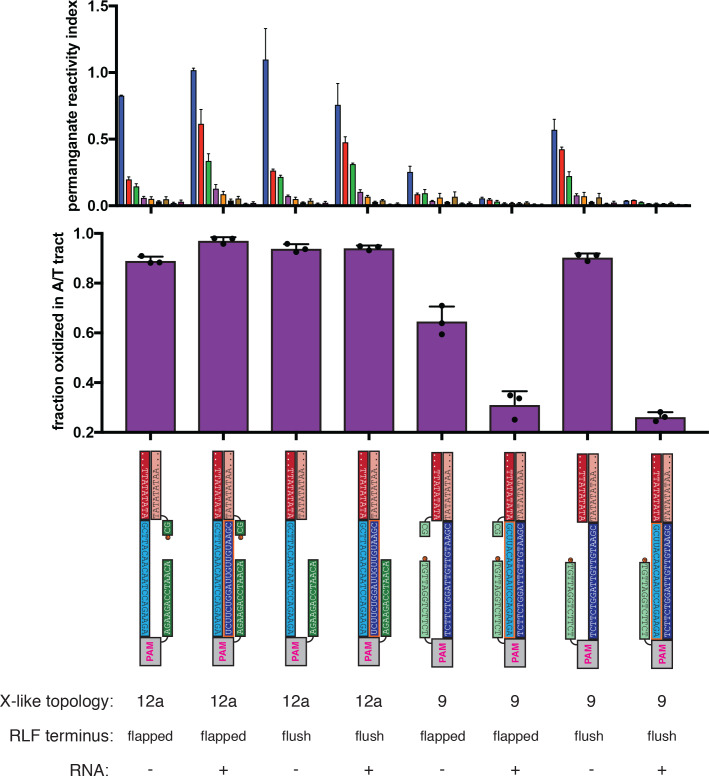
Figure 4—figure supplement 6. Effect of overhanging non-target-strand nucleotides on permanganate reactivity of the A/T tract in protein-free R-loops.

Figure 4—figure supplement 6.

Permanganate experiments were conducted as in Figure 2B (2 minutes, 30°C). See Materials and methods for description of the parameters plotted on the y-axis. Columns and associated error bars indicate the mean and standard deviation of three replicates. In all schematics, RNA molecules are outlined in orange, and DNA molecules are outlined in black. Circled ‘P’ indicates a 5′-phosphate. All sequences, when read right-side up, go from 5′ on the left to 3′ on the right. These experiments probe the role of the 2-nt NTS overhang (immediately adjacent to the R-loop flank) in distortion of the A/T tract. When present, this dinucleotide results in a ‘flapped’ R-loop flank (RLF) terminus, and when absent, the RLF terminus is ‘flush.’ The terms ‘(Cas)12a-like’ and ‘(Cas)9-like’ are descriptors only of each substrate’s R-loop topology (the end of the RNA next to the boundary of interest is a 3′ end or a 5′ end, respectively)—both kinds of substrates contain a Cas12a PAM and a Cas12a-like NTS gap. These results show that the presence of the overhang can affect the absolute magnitude of distortion, but the nature of the asymmetry is unaffected.
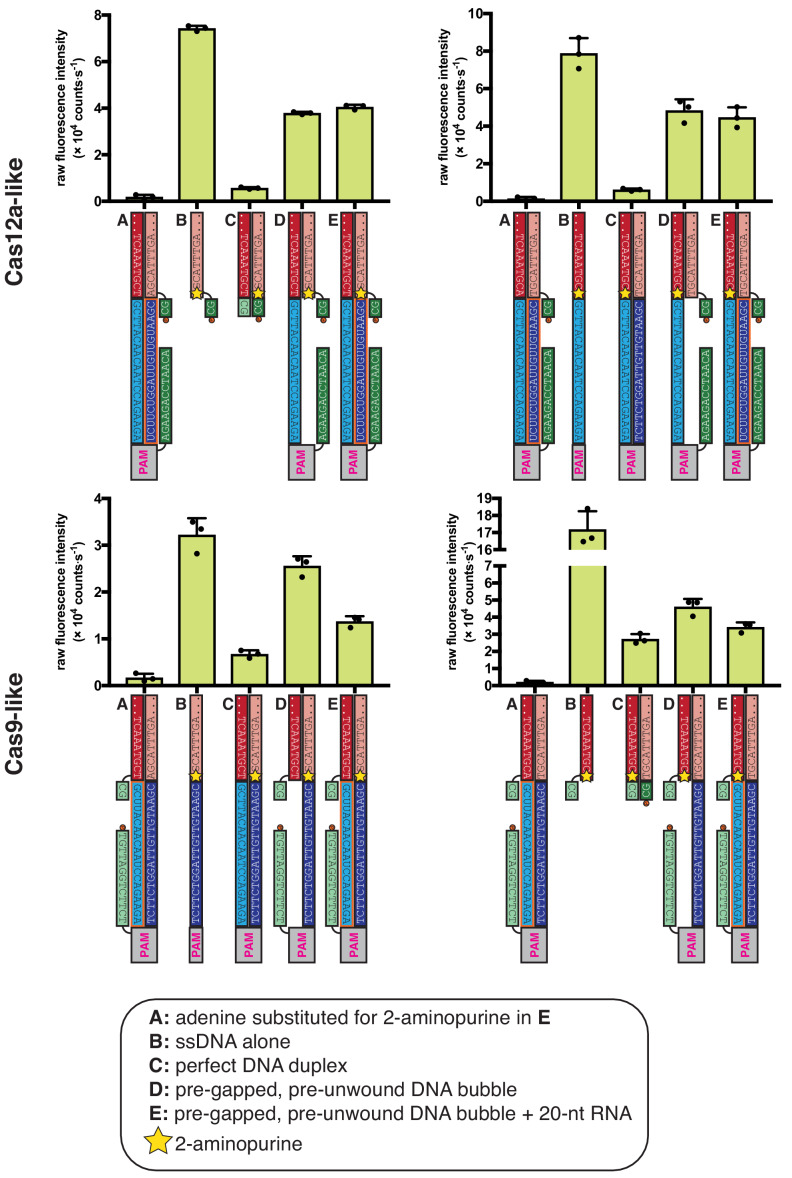
Figure 4—figure supplement 7. 2-aminopurine fluorescence measurements confirm asymmetry in conformational dynamics of R-loop flanks.

Figure 4—figure supplement 7.

Columns and error bars show mean and standard deviation of three replicates. In all schematics, RNA molecules are outlined in orange, and DNA molecules are outlined in black. Circled ‘P’ indicates a 5′-phosphate. All sequences, when read right-side up, go from 5′ on the left to 3′ on the right. The terms ‘Cas12a-like’ and ‘Cas9-like’ are descriptors only of each substrate’s R-loop topology (the end of the RNA next to the boundary of interest is a 3′ end or a 5′ end, respectively)—both kinds of substrates contain a Cas12a PAM and a Cas12a-like NTS gap. The absolute values of 2-AP fluorescence intensity have a wide range across different DNA probes, likely due to local sequence context or, in the case of the ssDNA control in the bottom right panel, perhaps the stable population of a conformation that enhances 2-AP fluorescence. Given this variation, it is important to use the perfect DNA duplex (C) and the pre-gapped/pre-unwound DNA bubble (D) conditions as benchmarks—on the continuum from C to D, where does E lie? For condition E in the Cas12a-like topologies, the 2-AP fluoresces as if the RNA were absent. For condition E in the Cas9-like topologies, 2-AP fluorescence is quenched and approaches the intensity of the fully duplex control.