. 2020 Jun 10;9:e55143. doi: 10.7554/eLife.55143

Figure 5. Energetics of base stacking at the R-loop boundary probed by optical measurements and molecular dynamics simulations.

(A) Melting temperatures of nicked-dumbbell constructs that recapitulate each type of R-loop boundary, determined by monitoring absorbance of ultraviolet light while slowly cooling samples from 95°C to 2°C. Reported values show mean and standard deviation of three replicates. See Figure 5—figure supplement 1 for refolding curves and control constructs. (B) Molecular dynamics simulations reveal nucleobase unstacking in 3' R-loop boundaries but not in 5' R-loop boundaries. At the top left is a schematized version of the true structural model shown immediately below (this coaxially stacked conformation is the starting structure that was used for simulation); hydrogens were present in the simulated model and analyses but are omitted from representations here for clarity. The simulated model contained only the nucleic acid molecules shown in stick representation; the protein and remainder of the R-loop are drawn in a schematic only to orient the reader as to where the simulated structure would fit into a full DNA-bound CRISPR interference complex; the Cas9-orientation R-loop is drawn with a Cas12a-like NTS gap to reflect the simulated model. The inset is a closeup of the two nucleotides on the ‘flapped’ side of the junction in the structural model; the 2'-OH is shown as a red sphere. Envelope surface area (ESA) was determined by isolating two nucleobases of the interhelical stack—that on the RNA terminus and that stacked upon it from the NTS—and calculating the surface area of the volume they jointly occupy over the course of each trajectory (envelope shown in cyan). High ESA values reflect unstacking of nucleobases, whereas low ESA values reflect a stacked architecture similar to that of the starting conformation. Pale lines are absolute ESA values, and bold lines are moving averages (1-ns sliding window). Data from ten independent 50-ns trajectories are shown in different colors. Simulations of a second set of sequences are described in Figure 5—figure supplement 2.

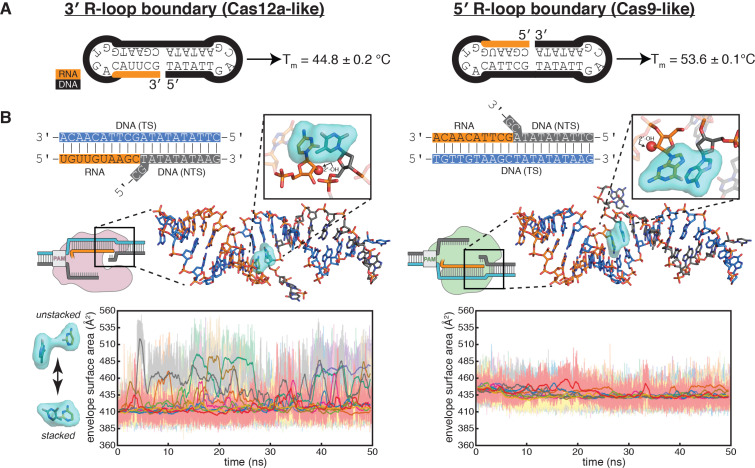
Figure 5—source data 1. Numerical data plotted in Figure 5 and accompanying figure supplements.
Figure 5—source data 2. Example molecular dynamics trajectories.

Figure 5.

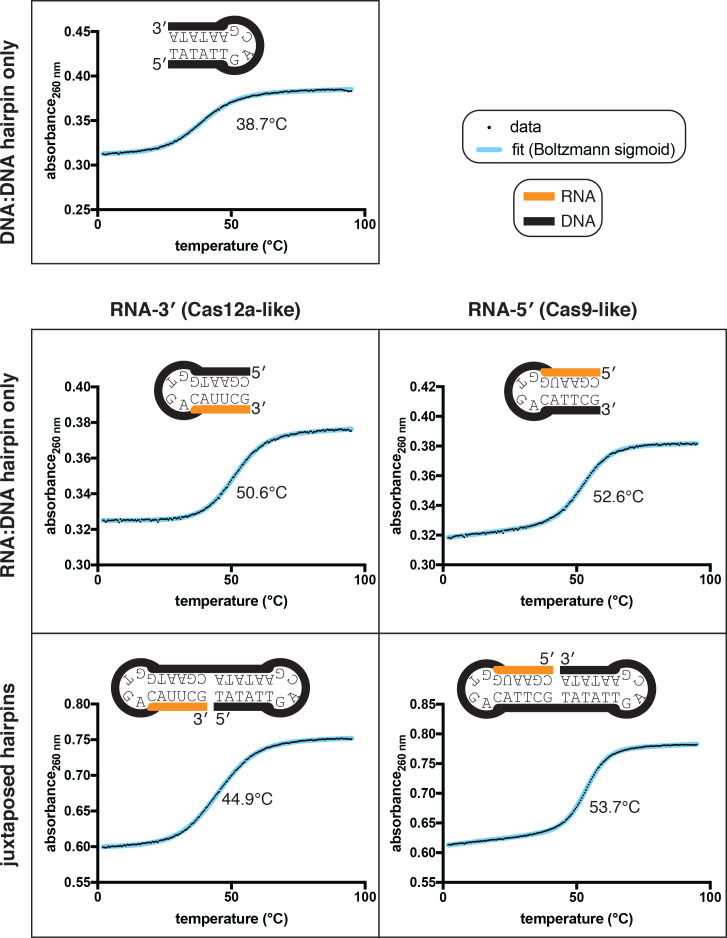
Figure 5—figure supplement 1. Thermal stability determination for nicked dumbbell substrates and their constituent hairpins.

Figure 5—figure supplement 1.

Data from representative replicates of refolding experiments (small black dots) are overlaid on a best-fit curve (thick blue line) comprising a Boltzmann sigmoid with inclined baselines (y = (m*x+b)+((n*x+c)-(m*x+b))/(1+exp((Tm-x)/slope))). Because the dumbbells contain two separate duplexes that can, in principle, fold and unfold independently of each other, each of these molecules likely has more than two states. Thus, while there is no obvious visual sign of multiple transitions in the refolding curves, we did not attempt to extract thermodynamic parameters from the slope, and the Tm (written in the center of each plot) should only be used as a point of comparison rather than as a determinant of a defined conformational ensemble. While the two RNA:DNA hairpins have slightly different Tm values, the much larger discrepancy in Tm of the nicked dumbbells is probably mostly due to the nature of duplex juxtaposition.
Figure 5—figure supplement 2. Molecular dynamics simulations of the Cas12a-like and Cas9-like interhelical junctions, Sequence 2.

Figure 5—figure supplement 2.

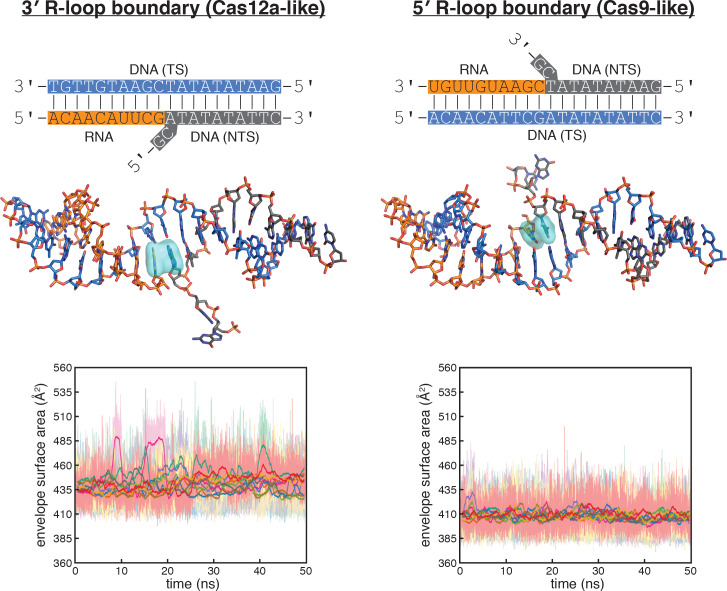
Schematics and data are presented as described in the legend to Figure 5B, which depicted simulation of Sequence 1. For Sequence 2, the nucleobases probed at the 3' R-loop boundary frequently exhibited unstacking or poorly stacked conformations (although to a lesser extent than in Sequence 1), while those probed at the 5' R-loop boundary were stably stacked over the course of the simulation. These results suggest that the difference in stacking instability detected for the interhelical junctions (with Sequence 1 or Sequence 2) are due to the difference in junction topology rather than the identities of the monitored nucleobases (pyrimidine/pyrimidine versus purine/purine).