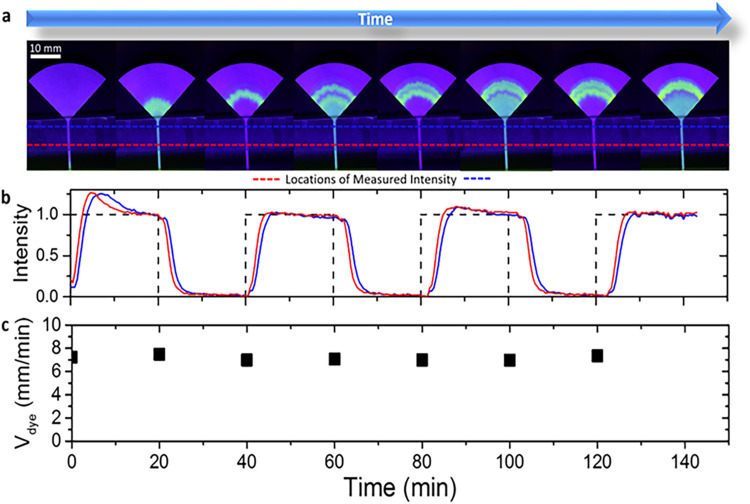
FIG. 2.
(a) Images of a paper strip during testing where the sampled fluid was periodically exchanged between DI water and a fluorescent dye every 20 min. The corresponding time-lapse video can be seen in Video S1 in the supplementary material. (b) Image analysis shows that the intensity of the dye oscillates in the encased channel as the bands of dye are transported towards the evaporation pad. One measurement was performed at the bottom of the channel (red dotted line) and the other was measured near the top of the channel (blue dotted line). (c) The velocity of the dye was calculated at each step. Note that the flow remains constant over a 2 h span.

