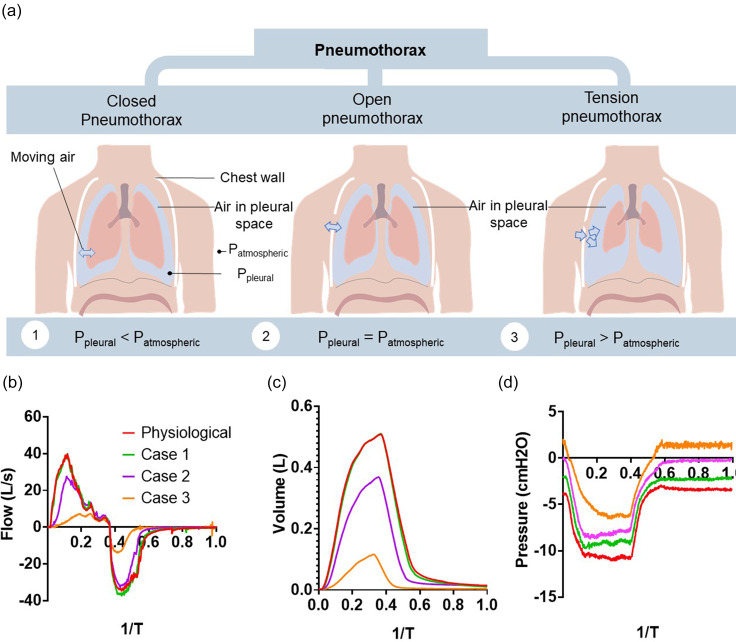
FIG. 7.
Simulating the mechanical effects of a pneumothorax. (a) Schematic depicting the different categories of pneumothorax. (b) The ventilatory airflow measured for varying degrees of a pneumothorax. (c) The tidal volume generated for the varying degrees of a pneumothorax. (d) The measured pleural pressure in the varying degrees of a pneumothorax.

