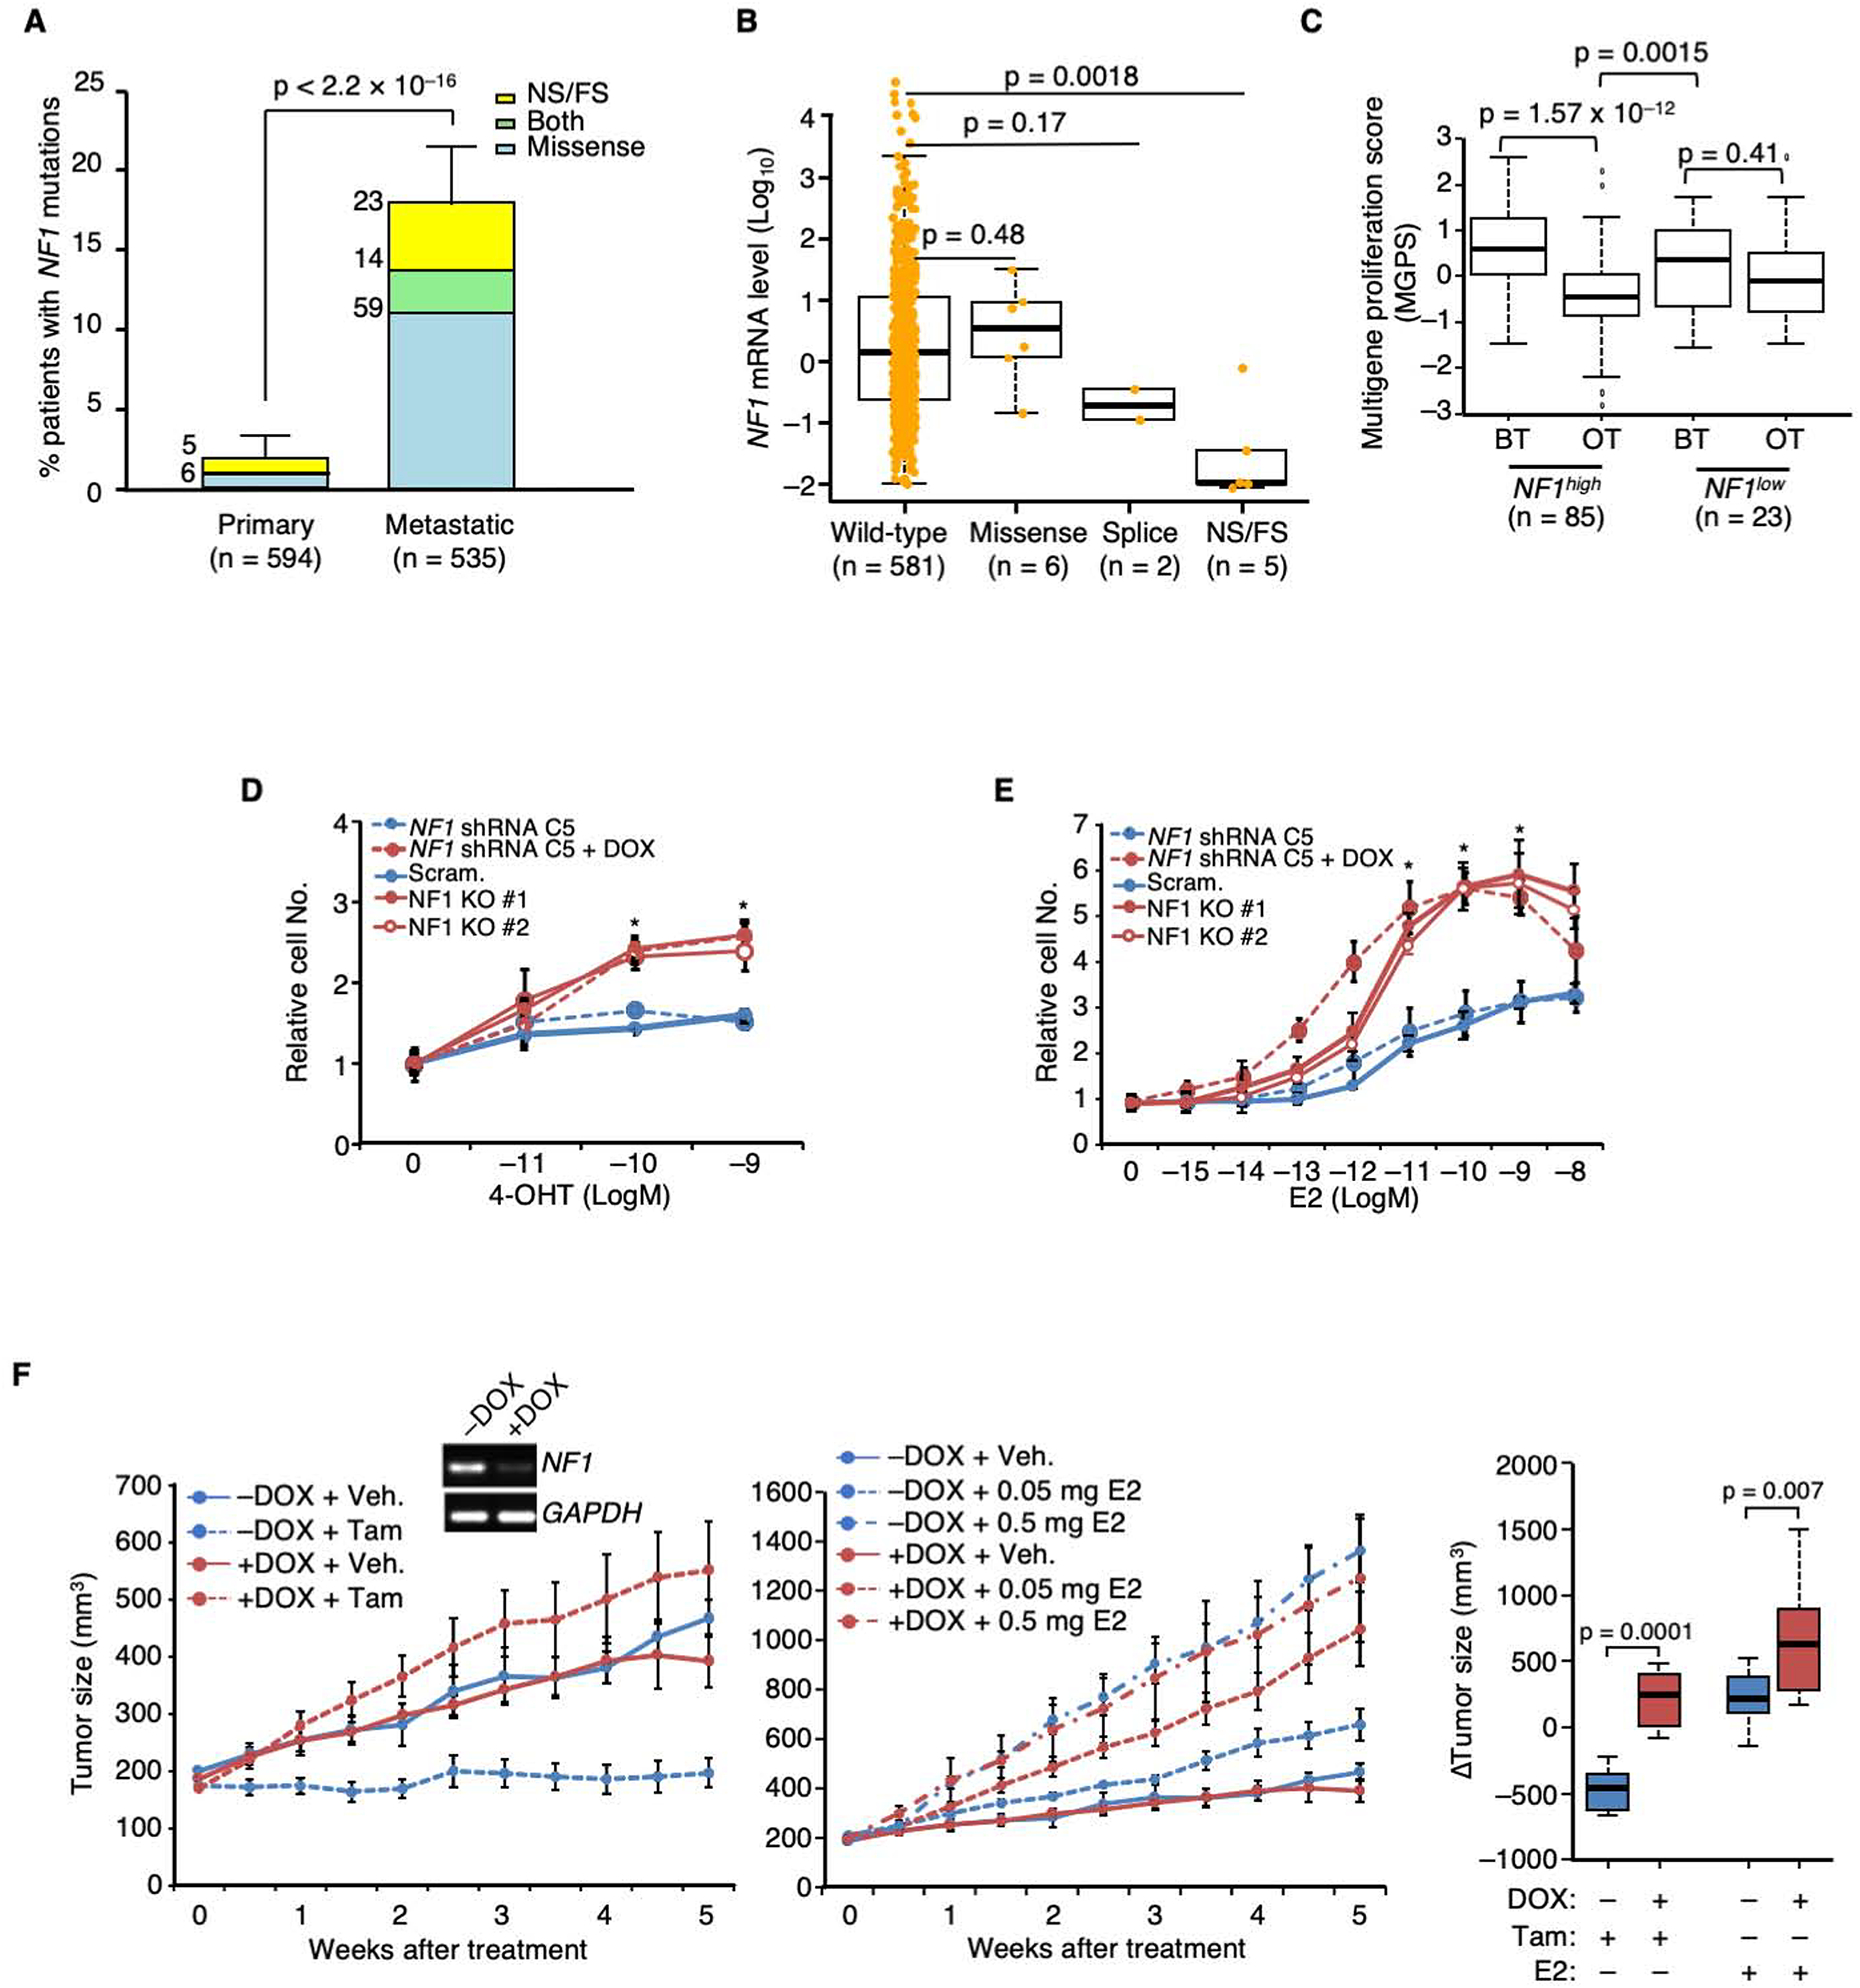
Figure 1. NF1 loss promotes tamoxifen agonism and E2 hypersensitivity leading to poor patient outcome in ER+ breast cancer.

A. The percentages of ER+ primary vs. metastatic breast cancers carrying NF1 mutations were analyzed by Fisher Exact test. NS and FS stand for nonsense and frameshift, respectively. The number of patients carrying a particular type of NF1 mutation is shown at the upper left side of each column. B. Boxplot analysis of NF1 mRNA levels in ER+ breast tumors carrying different NF1 mutations in the RNA-seq database of TCGA. P value by Wilcoxon rank sum test. The line in the middle of the box is the median. The box edges are the 25th and 75th percentiles and the whiskers denote 1.5 times the inter-quartile range. C. Patient samples were stratified by NF1 mRNA levels according to TCGA definitions of high vs. low expression (mean – 1.5 × SD). The boxplot analysis was similarly performed as in (B) to compare multigene proliferation score (MGPS) in tumors before treatment (BT) and on treatment (OT) with AI. The differences in MGPS before and during treatment in each NF1 group were analyzed by the Wilcoxon signed-rank test. The differences in MGPS as a result of treatment between the two NF1 groups were further analyzed by Wilcoxon rank sum test. D. DOX-inducible gene silencing using NF1 shRNA clone C5 and CRISPR-mediated NF1-KO were performed in MCF-7 cells. These cells were seeded in E2-deprived medium, to which 4-OHT was added, and cultured for 6 days. Cell numbers relative to vehicle control are plotted. Experiments were conducted as biological triplicates (n = 3 experiments), except for MCF-7 cells carrying NF1 shRNA C5 (n = 8 experiments). E. Cell growth in response to E2 was similarly analyzed as in (D). n = 3 experiments, except for MCF-7 cells carrying NF1 shRNA C5 (n = 8 experiments). F. MCF-7 cells carrying DOX-inducible NF1 shRNA were transplanted into the mammary fat pads of ovariectomized nude mice, supplemented by an E2-capsule. When tumors appeared, the original E2-capsule was removed, and the resulting mice were randomized, DOX or vehicle treated. Each set was then treated by either tamoxifen (5 mg/mouse, left), or E2 (at two doses, middle). For NF1+ (−DOX) tumors, n=10, 12, 12, and 8 mice per group for treatment of vehicle, 0.05 mg E2, 0.5 mg E2, and tamoxifen; for NF1KD (+DOX) tumors, n = 10, 13, 11, and 8 mice per group. The inset shows NF1-silencing validation by qPCR 2 weeks post-DOX addition. Data are reported as mean±SEM. On the far right, “Δ tumor volumes” between vehicle and either tamoxifen or E2 treated were analyzed by box plot as in (C). *p<0.05, **p<0.01 by pair-wise two-tailed Student’s t-test, unless otherwise indicated.
