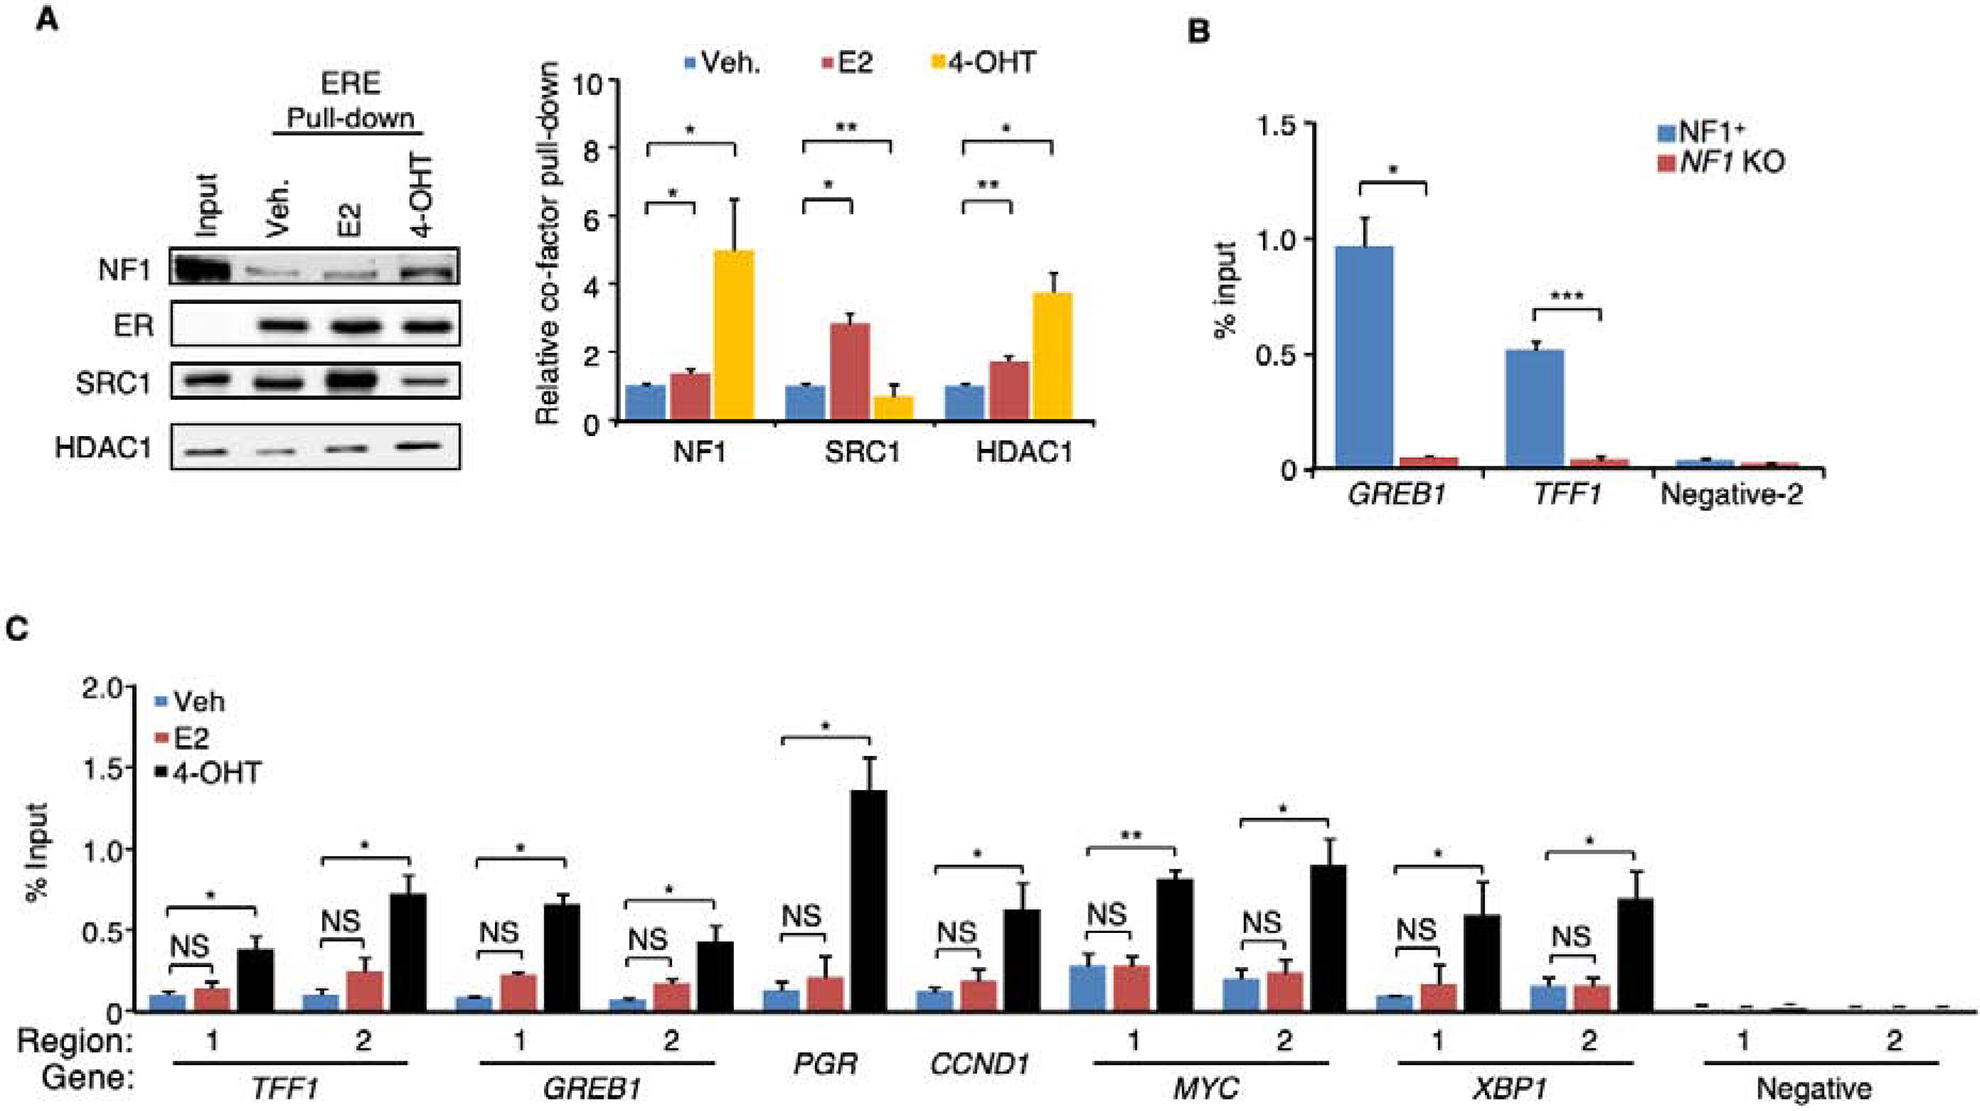
Figure 5. Ligand-dependent association of neurofibromin with the ER-ERE complex.

A. Ligands were added to the HeLa nuclear extract together with purified ER and biotinylated EREs immobilized onto streptavidin beads. After washing, the proteins bound to EREs with ER were analyzed by immunoblotting (left) and quantified (right). n = 4 experiments. B. ChIP-qPCR experiment was performed using NF1 antibody Ab-2 to assess NF1 occupancy at the EREs in GREB1 (Region 2, Figure 2C) or TFF1 (Region 1, Figure 2C) in parental or NF1-KO (clone 1) MCF-7 cells treated with 4-OHT. An ERE-negative region (site 2) (Carroll et al., 2006) was also analyzed as negative control. n = 2 experiments. C. NF1 occupancy in MCF-7 cells at ten ERE sites in six genes and two negative control regions was assessed by qPCR (n=3 separate ChIP experiments). Data are reported as mean±SEM. *p<0.05, **p<0.01, ***p<0.001 by pair-wise two-tailed Student’s t-test. NS, not significant.
See also Figure S5.
