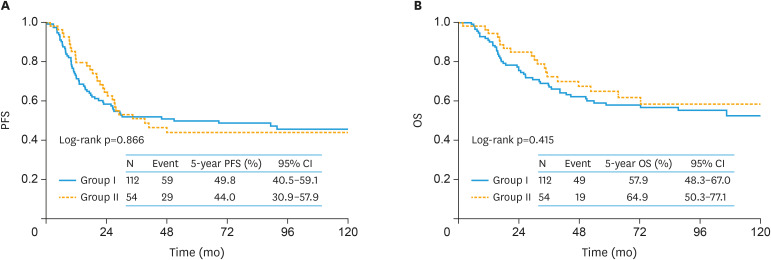
Fig. 3. The original cohort. Kaplan-Meier-estimated survival curves on stratifying by the surgical type (group I [n=112] vs. group II [n=54]).
Group I is patients who received standard surgery with complete SRL and group II is patients who underwent non-staging limited surgery.
CI, confidence interval; OS, overall survival; PFS, progression-free survival.

