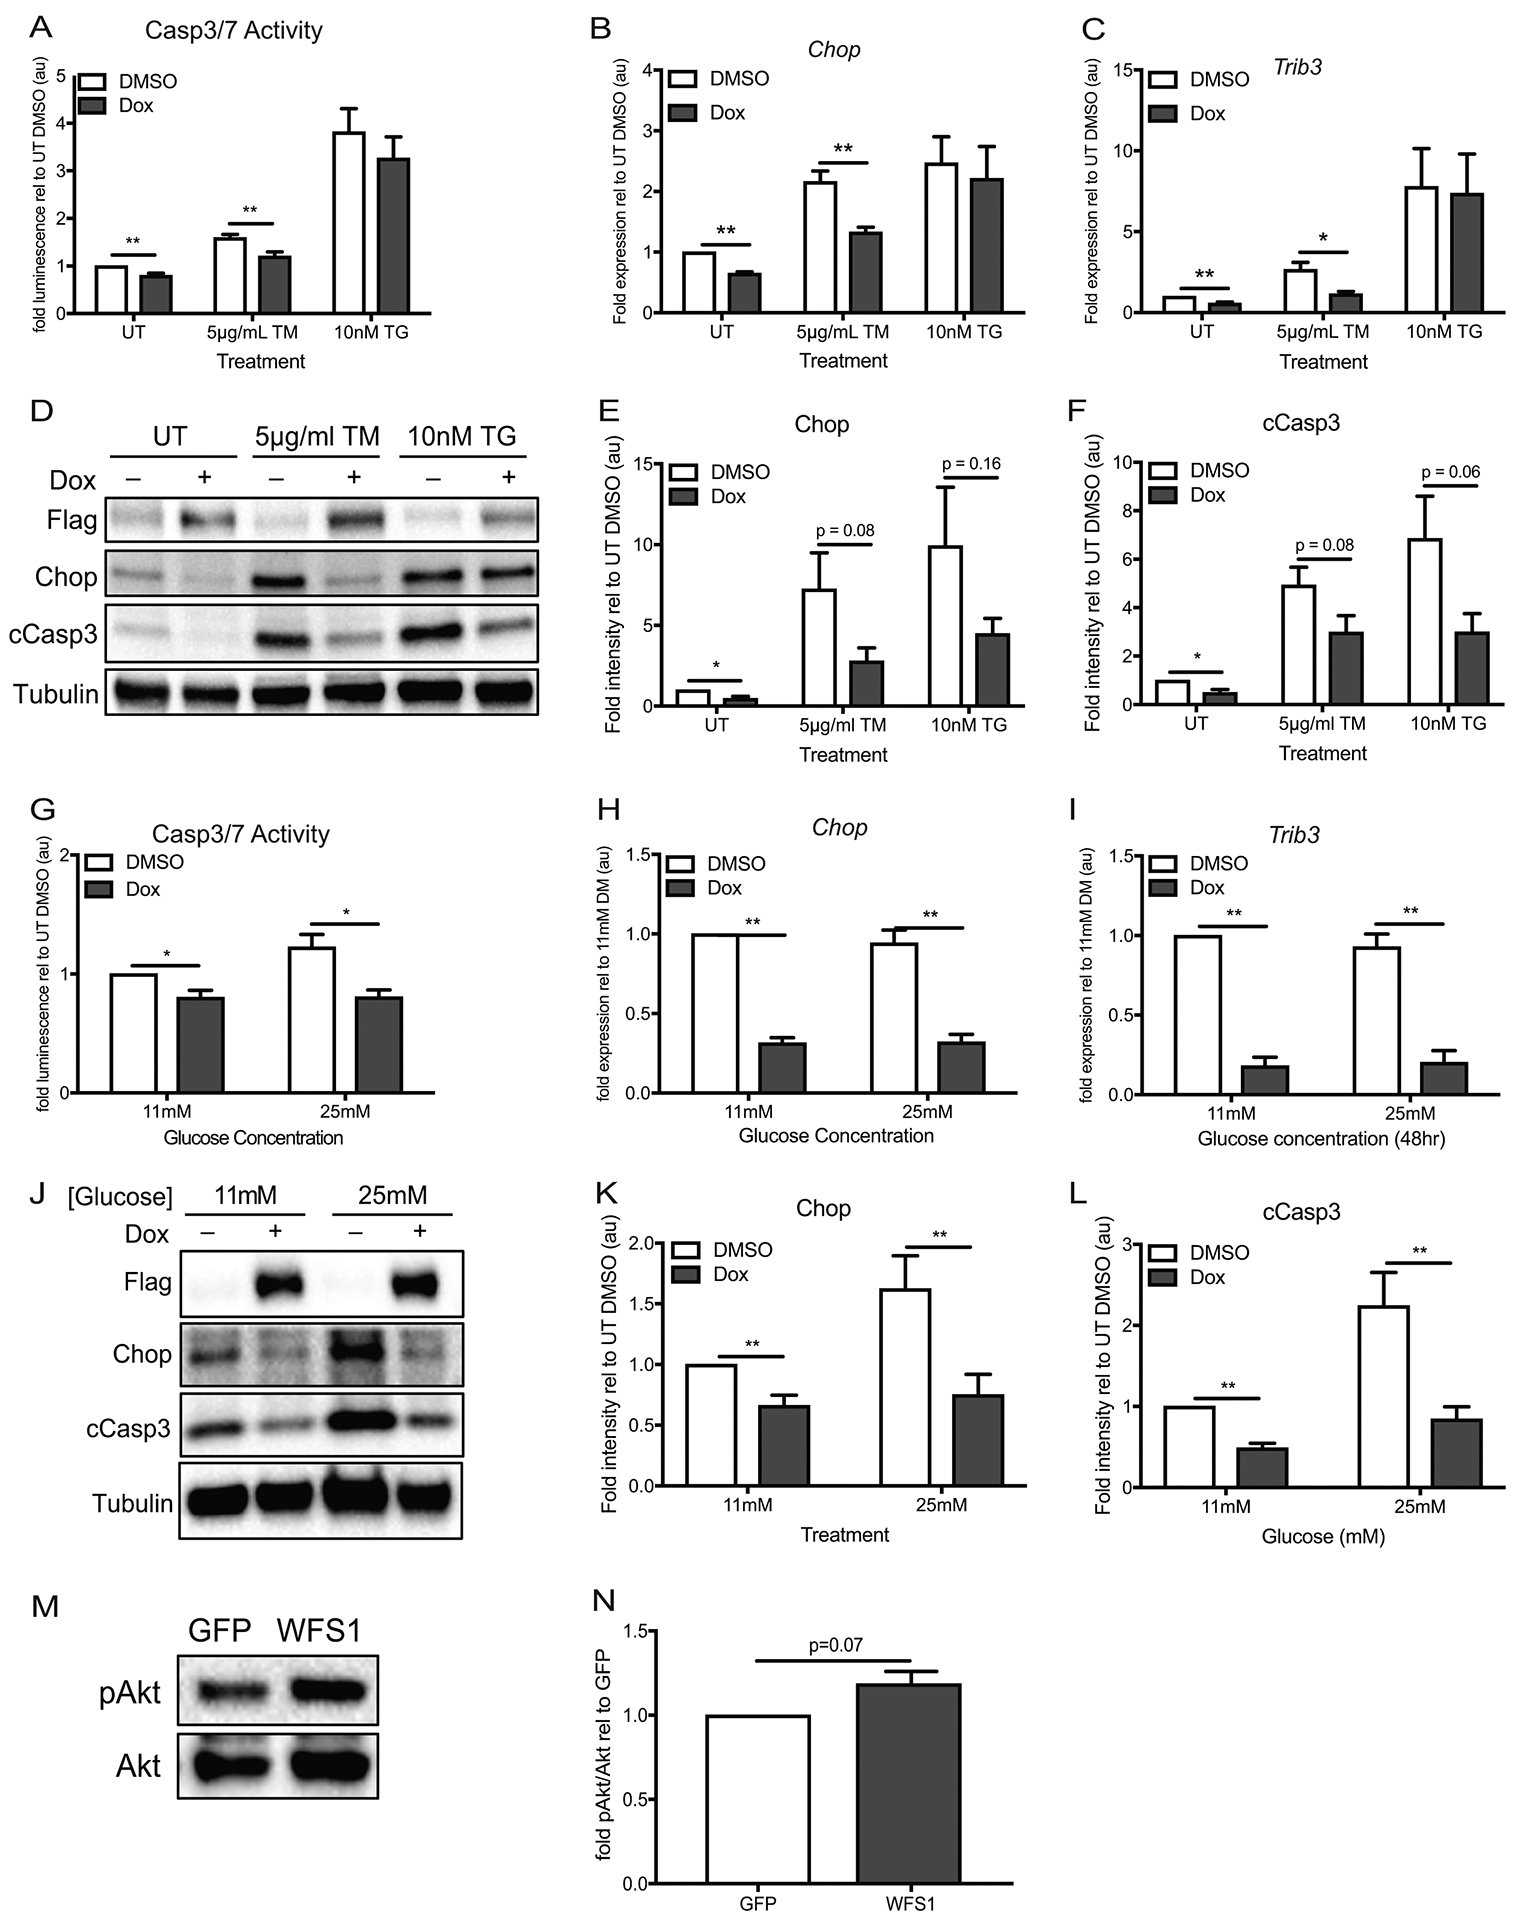
Figure 3. WFS1 overexpression suppresses ER stress-mediated cell death.

(A) INS-1 832/13 with inducible pTetR Tet On (TO) Flag-tagged WFS1 overexpression were treated with DMSO or doxycycline for 48 hours, followed by 16 hours of no treatment (UT) or chemical ER stress by specified doses of tunicamycin (TM) or thapsigargin (TG) before measurement of caspase 3/7 activity (n=8 for all conditions, **p< 0.01). (B-C) Relative expression of Chop and Trib3 by quantitative PCR in cells treated as (a) (n=4 for all conditions, *p<0.05, **p< 0.01). (D) Immunoblot analysis of Chop and cleaved caspase 3 expression in cells treated as (A). (E-F) Quantification of Chop and cCasp3 protein expression relative to untreated control cells—UT DMSO (n=8 for all conditions, *p<0.05). (G) INS-1 832/13 with inducible pTetR TO Flag-tagged WFS1 overexpression were treated with DMSO or doxycycline for 48 hours in 11mM glucose or 25mM glucose media prior to measurement of caspase 3/7 activity (n=4 for all conditions, *p< 0.05). (H-I) Relative expression of Chop and Trib3 by quantitative PCR in cells treated as (G) (n=4 for all conditions, **p< 0.01). (J) Immunoblot analysis of Chop and cleaved caspase 3 expression in cells treated as (G). (K-L) Quantification of Chop and cCasp3 protein expression relative to untreated control cells—11mM glucose DMSO (n=8 for Chop quantification, n=9 for cCasp3 quantification, **p< 0.01). (M) Immunoblot analysis of Wfs1, p(473)-Akt and total Akt expression in WT INS1 832/13 cells transduced with GFP or WFS1 lentivirus (n=3). (N) Quantification of p(473)-Akt/Akt in WFS1 overexpression (WFS1) cells relative to WT control (GFP) cells (n=3). White bars represent data from control cells and blue bars indicate data from WFS1 overexpression cells. Data are represented as mean ± SEM from at least four independent experiments. Statistical significance was determined by unpaired t-test.
