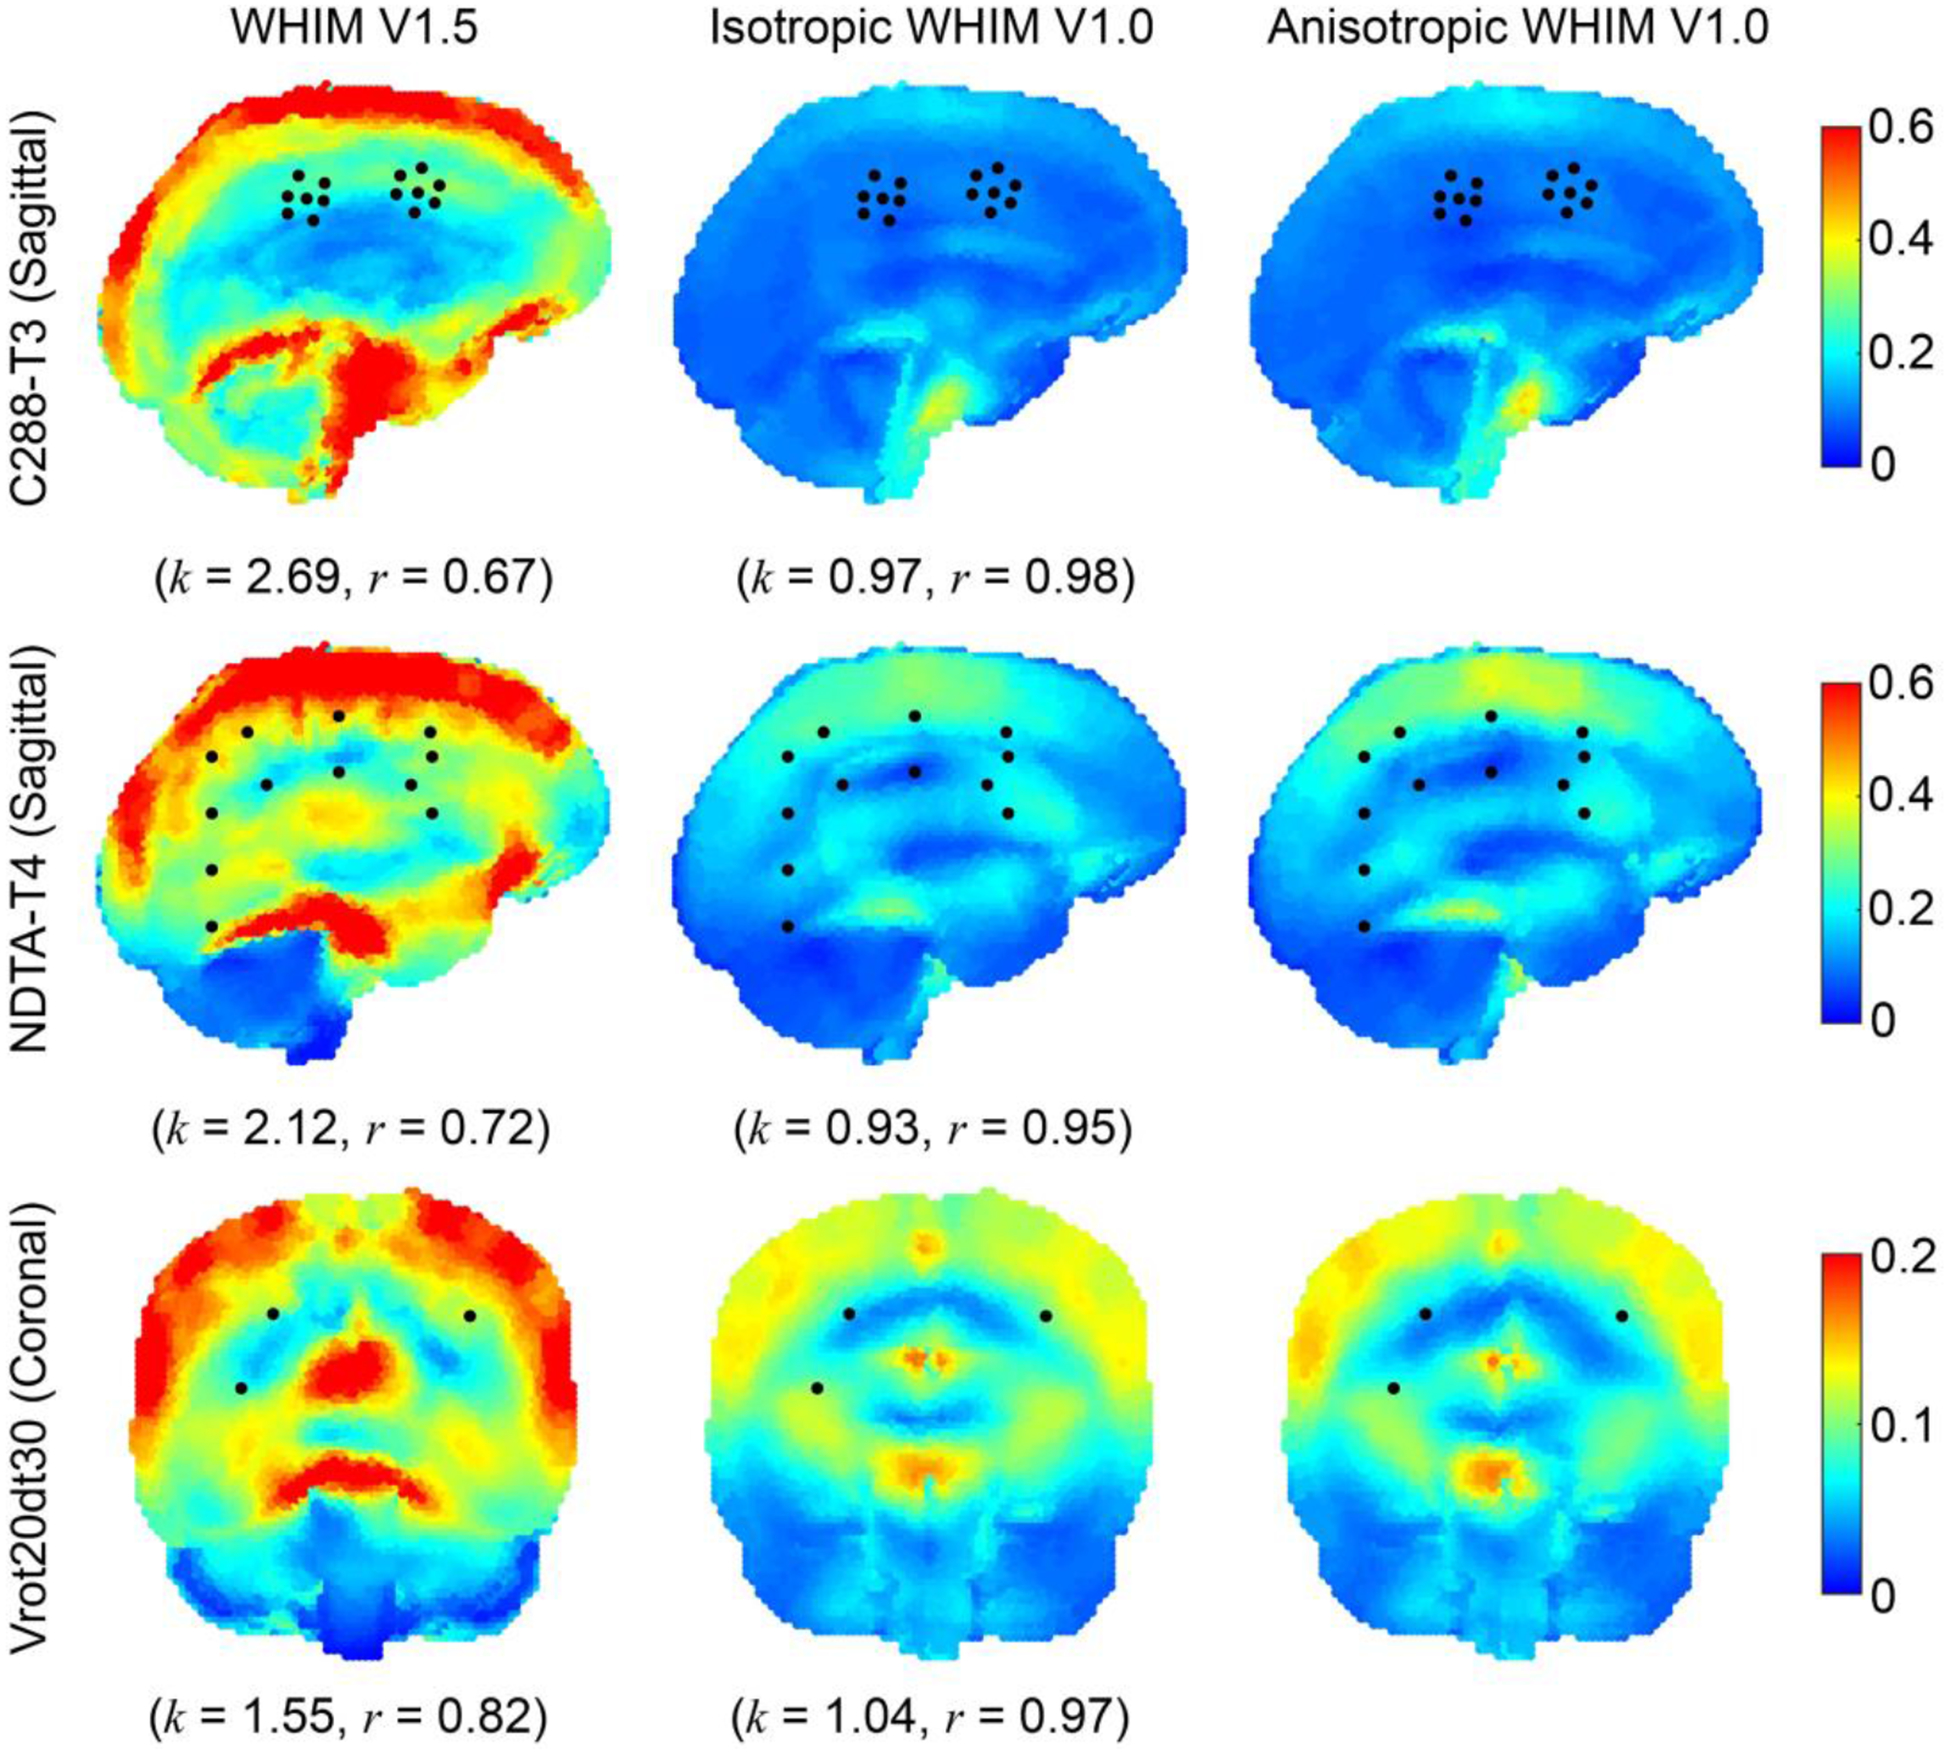
Fig. 7.

Cumulative peak MPS fringe plots for a high-rate impact (C288-T3, parasagittal plane in the middle of the right hemisphere through the cluster centroid; top) and two mid-rate cadaveric pure rotations (NDTA-T4, parasagittal plane in the middle of the right hemisphere; middle; and Vrot20dt30, coronal plane through receiver #16; bottom), along with projected locations of NDTs or crystals (shown as black dots) used to experimentally sample brain displacements. Comparisons in terms of linear regression slope (k) and Pearson correlation coefficient (r) relative to the anisotropic WHIM V1.0 reference are also reported.
