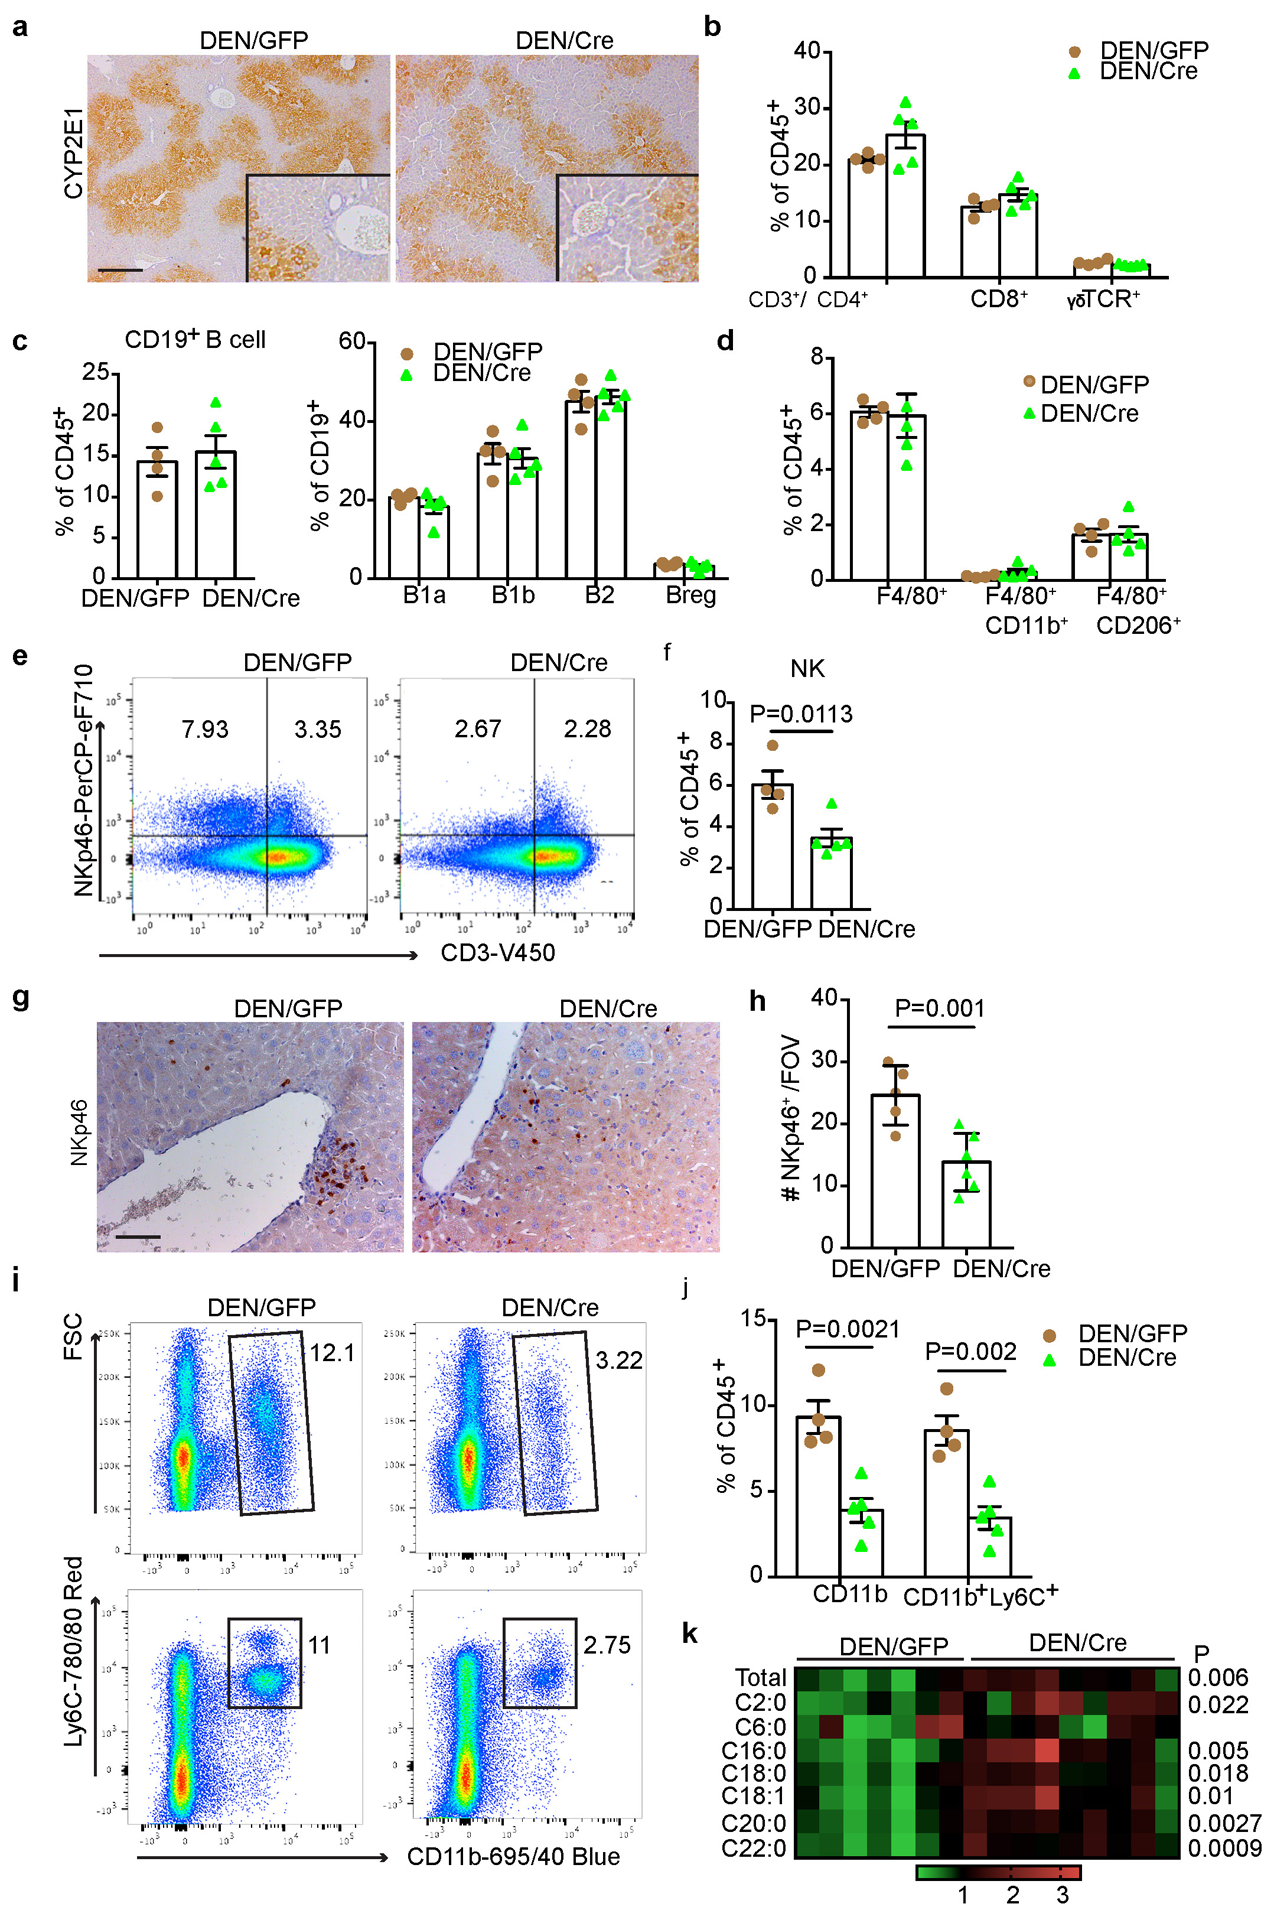
Extended Data Fig. 4. Impact of hepatic FBP1 loss on tumour microenvironment in DEN mice.

(a) Representative CYP2E1 IHC staining in liver sections from 24-week DEN/GFP and DEN/Cre mice (n=3 independent experiments). Scale bar: 100 μm. (b) Flow cytometry quantification of T cell subpopulations in 24-week DEN/GFP (n=4) and DEN/Cre (n=5) livers. (c) Flow cytometry quantification of B cells and B cell subpopulations in 24-week DEN/GFP (n=4) and DEN/Cre (n=5) livers. (d) Flow cytometry quantification of total macrophages and CD11b+ or CD206+ subsets in 24-week DEN/GFP (n=4) and DEN/Cre (n=5) livers. (e, f) Representative flow cytometry plots (e) and quantification (f) (% CD45+ cells) of NK cells (CD3−NKp46+) in 24-week DEN/GFP (n=4) and DEN/Cre (n=5) livers. (g, h) Representative NKp46 IHC staining (g) and quantification (h) in 24-wk DEN/GFP (n=4) and DEN/Cre (n=5) liver sections. Scale bar: 100 μm. (i, j) Representative flow cytometry plots (i) and quantification (j) (% CD45+ cells) of MDSC cells (CD11b+Ly6C+) in 24-week DEN/GFP (n=4) and DEN/Cre (n=5) livers. (k) A heatmap showing relative abundance of individual ceramide species in 24-wk DEN/GFP (N=7) and DEN/Cre (n=9) mouse livers by lipidomic profiling. Graphs in b-d, f, h and j show mean ± SEM, and P values were calculated using a two-tailed t-test. Numerical source data are provided in Source Data Extended Data Fig. 4.
