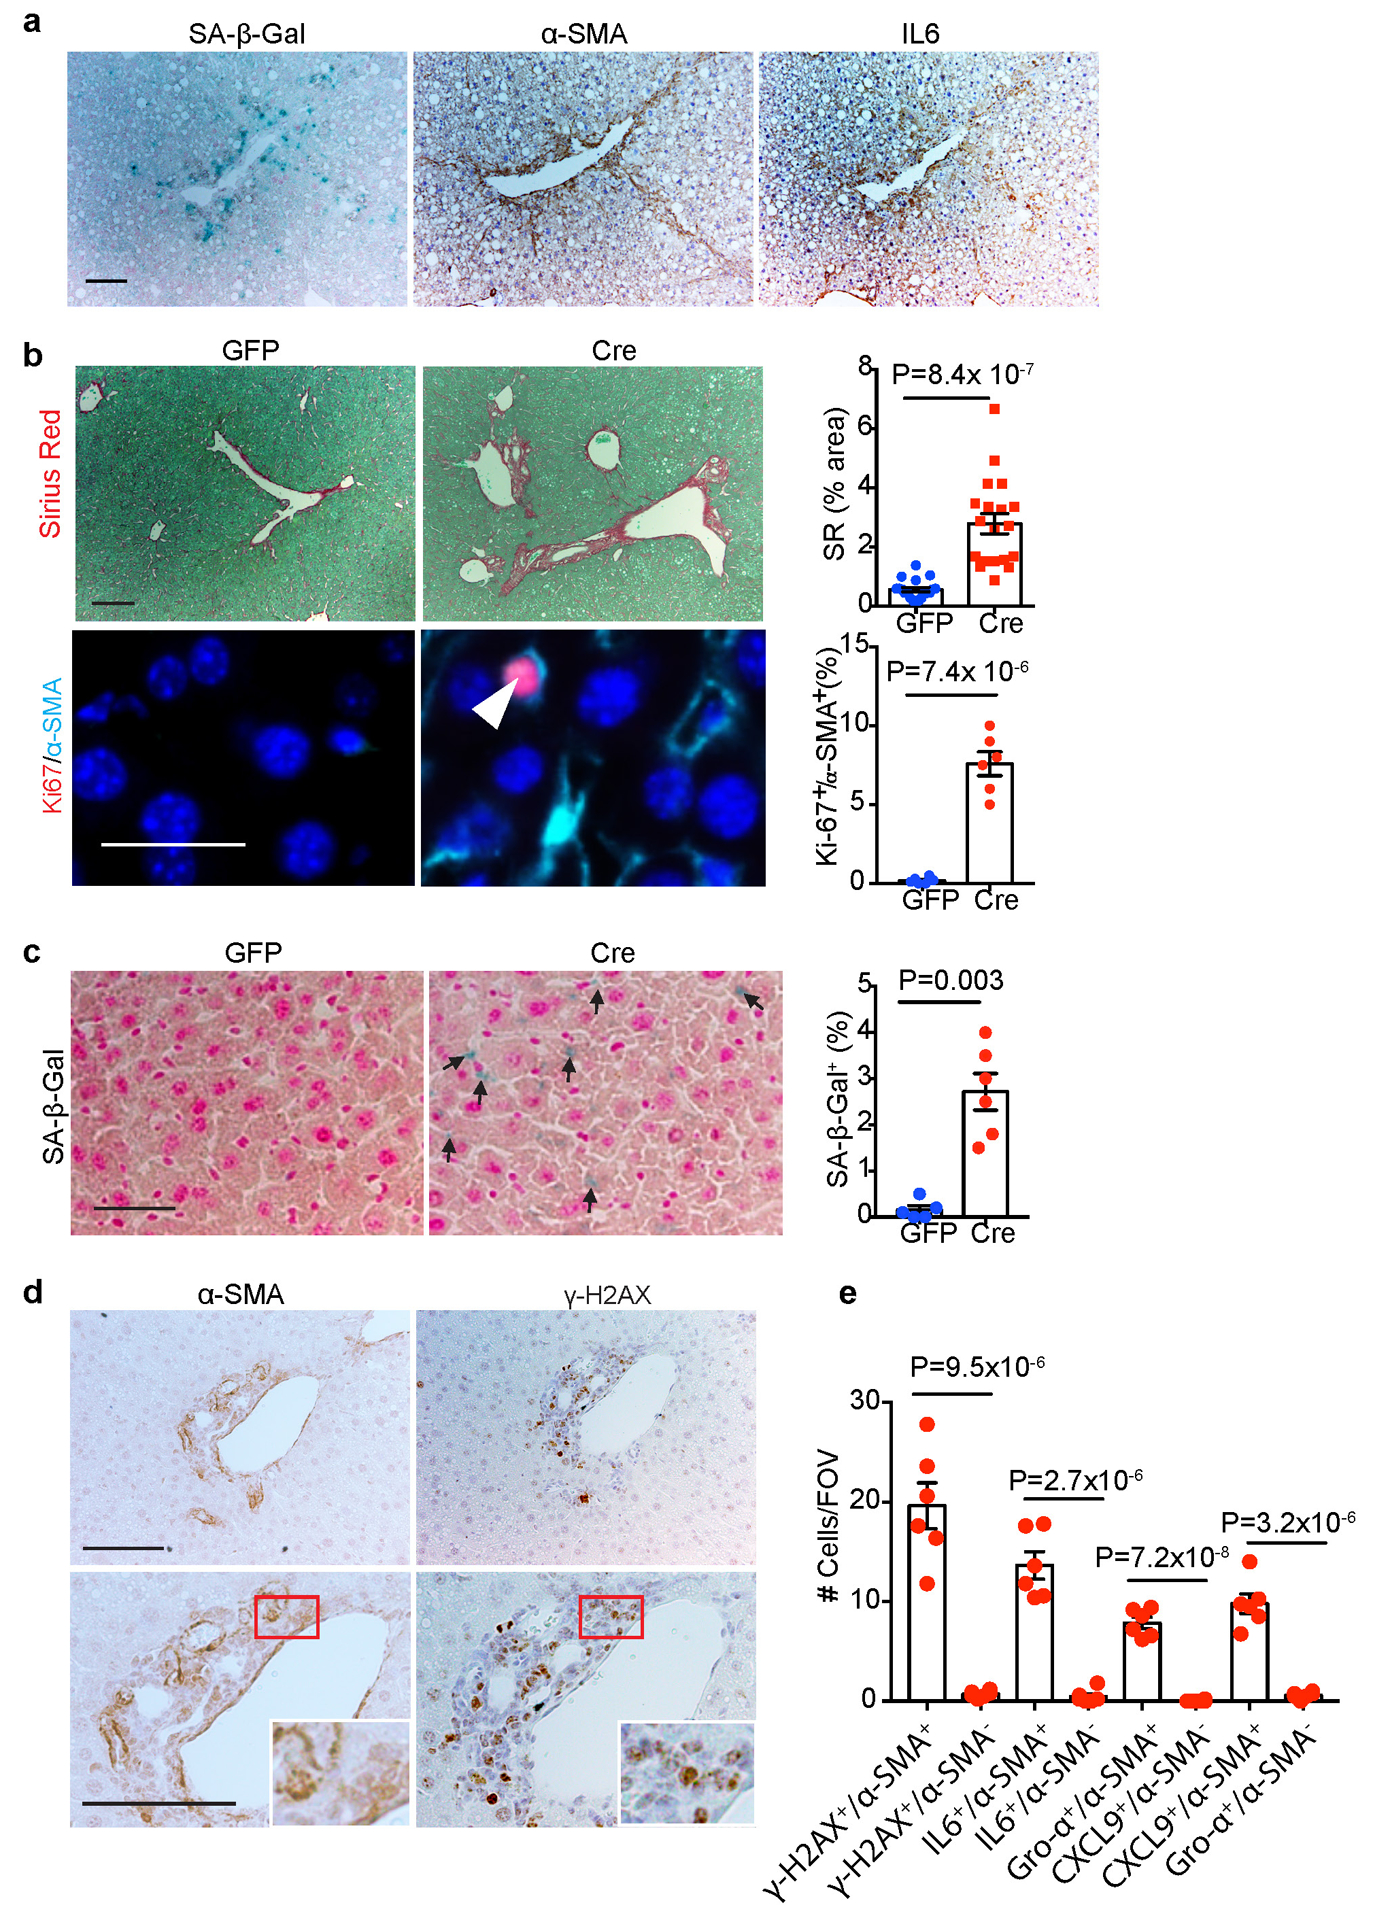
Extended Data Fig. 5. Hepatic FBP1 loss leads to HSC activation and senescence.

(a) Representative SA-β-Gal staining, α-SMA and IL6 IHC staining of serial cryosections from 36-week mouse livers (n=3 independent experiments). Scale bar: 100 μm. (b) Representative Sirius Red staining and quantification, Ki67/α-SMA IF staining and quantification of 24-week non-DEN liver sections. For Sirius Red staining quantification, n=20 fields of view (FOV, 200x) from 6 mice for GFP, n=18 fields of view (FOV, 200x) from 6 mice for Cre. For Ki67/α-SMA IF staining quantification, n=6 mice for each group. Scale bar: 100 μm. (c) SA-β-Gal staining and quantification (% of cells) in 24-week liver sections from non-DEN mice. Black arrows indicate SA-β-Gal staining. n=6 mice for each group. Scale bar: 100 μm. (d) α-SMA and γ-H2AX IHC staining of 24-week non-DEN Cre liver sections. Scale bar: 100 μm. (e) Quantification of α-SMA/γ-H2AX IHC staining and SASP component IF staining of 24-week non-DEN Cre (n=6) liver sections. Graphs in b, c and e show mean ± SEM, and P values were calculated using a two-tailed t-test. Numerical source data are provided in Source Data Extended Data Fig. 5.
