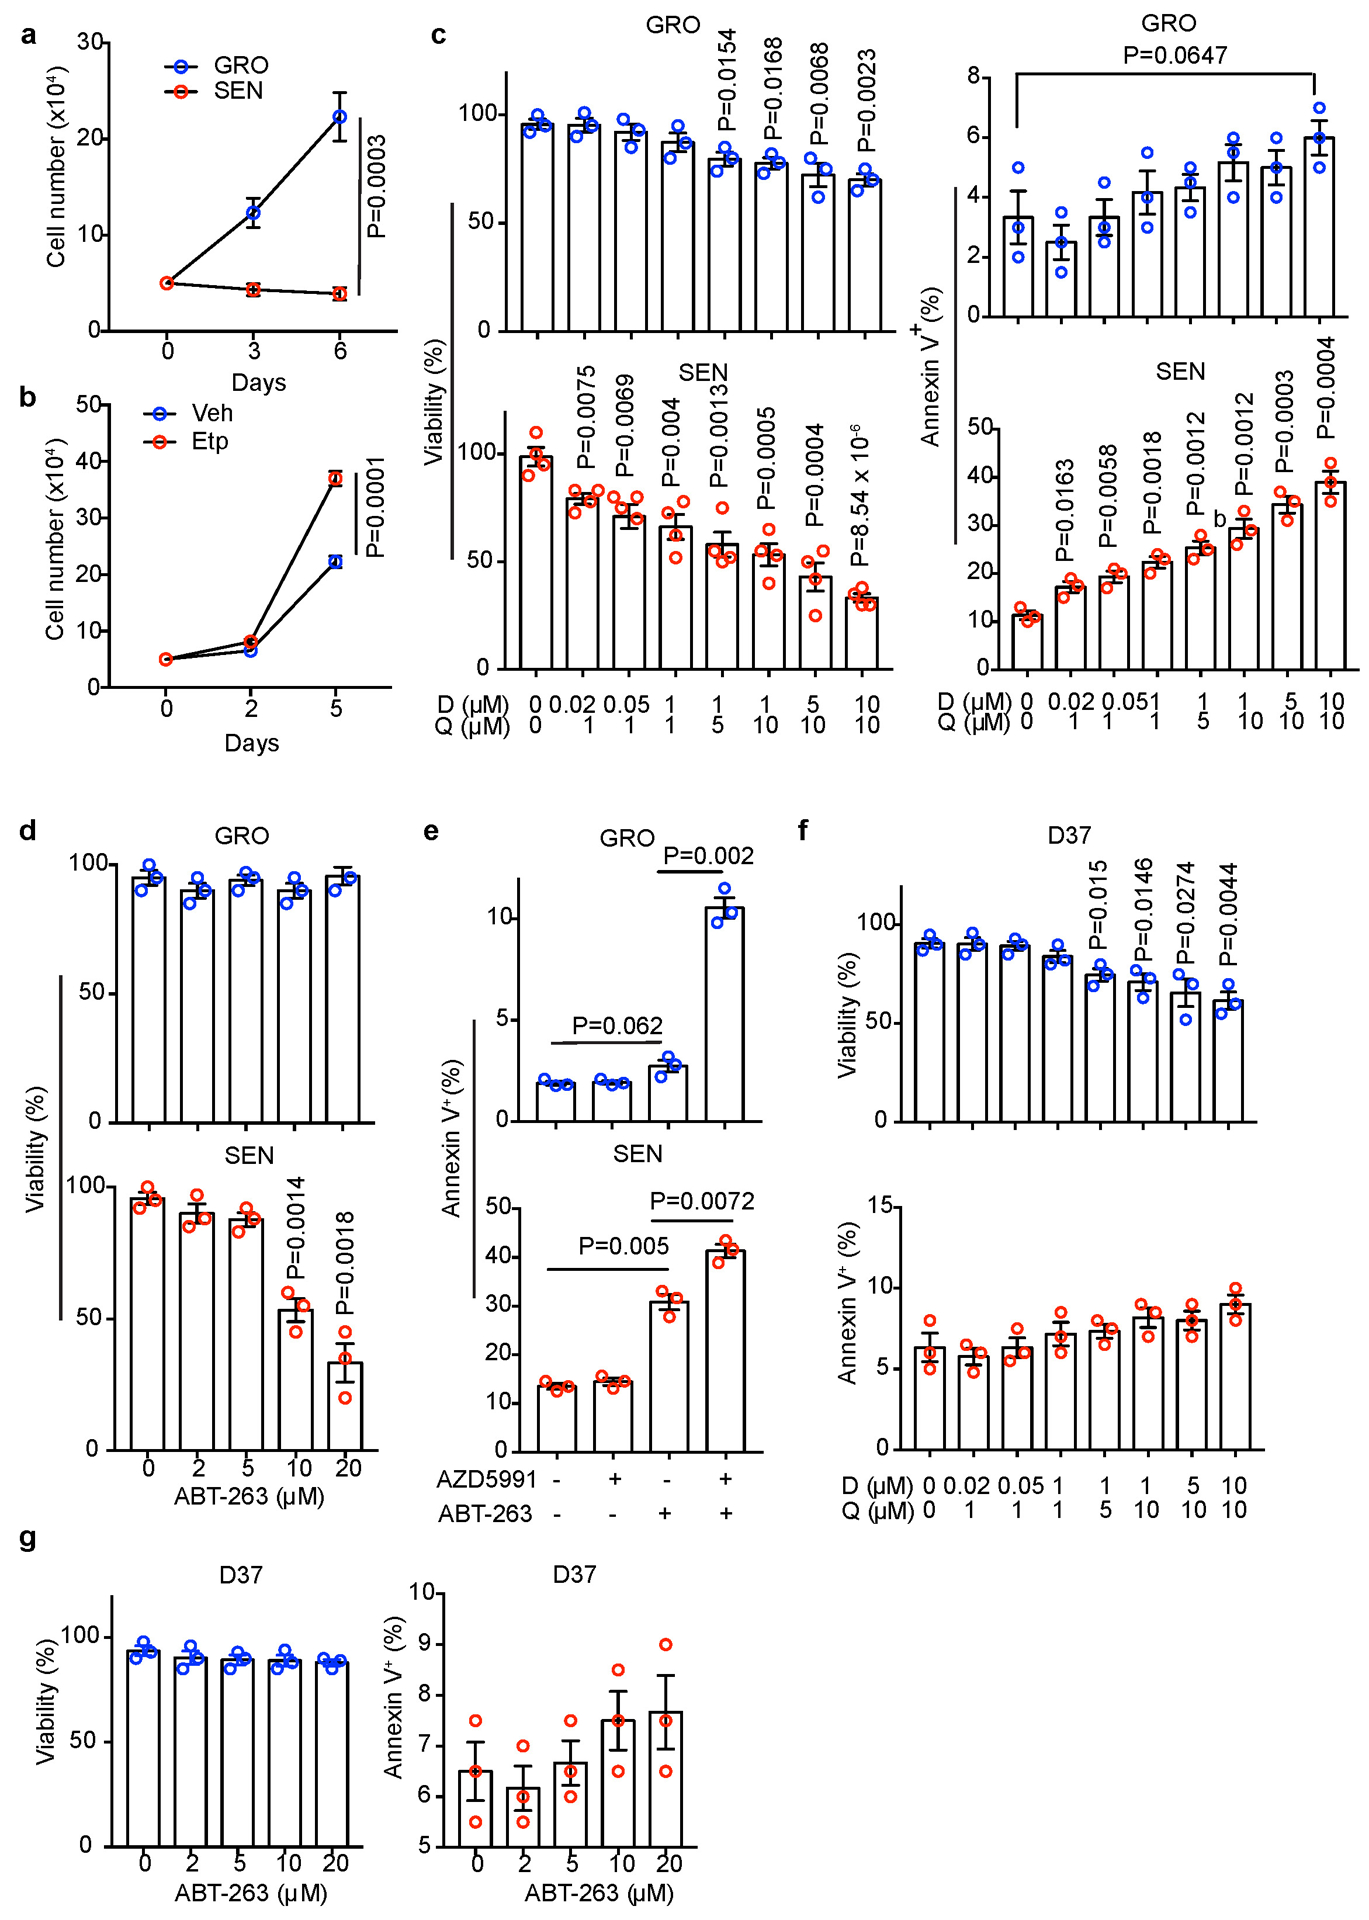
Extended Data Fig. 6. In vitro Characterization of senolytic effects of D+Q and ABT-263.

(a) Growth curves of GRO and SEN human HSCs under 3% O2 (to prevent senescence due to oxidative damage) in regular medium (n=3 independent experiments). (b) Growth curves of mouse D37 cells under 3% O2 in conditioned medium from Vehicle (Veh) or etoposide (Etp)-treated mouse HSCs (n=3 independent experiments). (c) Viability or apoptosis (% Annexin V+) quantification of GRO or SEN human HSCs after D+Q treatment at indicated concentrations/combinations (n=3 or independent experiments). (d) Viability or apoptosis (% Annexin V+) quantification of GRO or SEN human HSCs after treatment with ABT-263 at indicated concentrations (n=3 independent experiments). (e) Apoptosis (% Annexin V+) quantification of GRO or SEN human HSCs after treatment with indicated AZD5991 (50 nM) and ABT-263 (10 μM) combinations (n=3 independent experiments). (f) Viability or apoptosis (% Annexin V+) quantification of mouse D37 cells after D+Q treatment at indicated concentrations/combinations (n=3 independent experiments). (g) Mouse D37 cell viability or apoptosis (% Annexin V+) quantification after treatment with indicated ABT-263 concentrations (n=3 independent experiments). All graphs show mean ± SEM, and P values were calculated using a two-tailed t-test. Numerical source data are provided in Source Data Extended Data Fig. 6.
