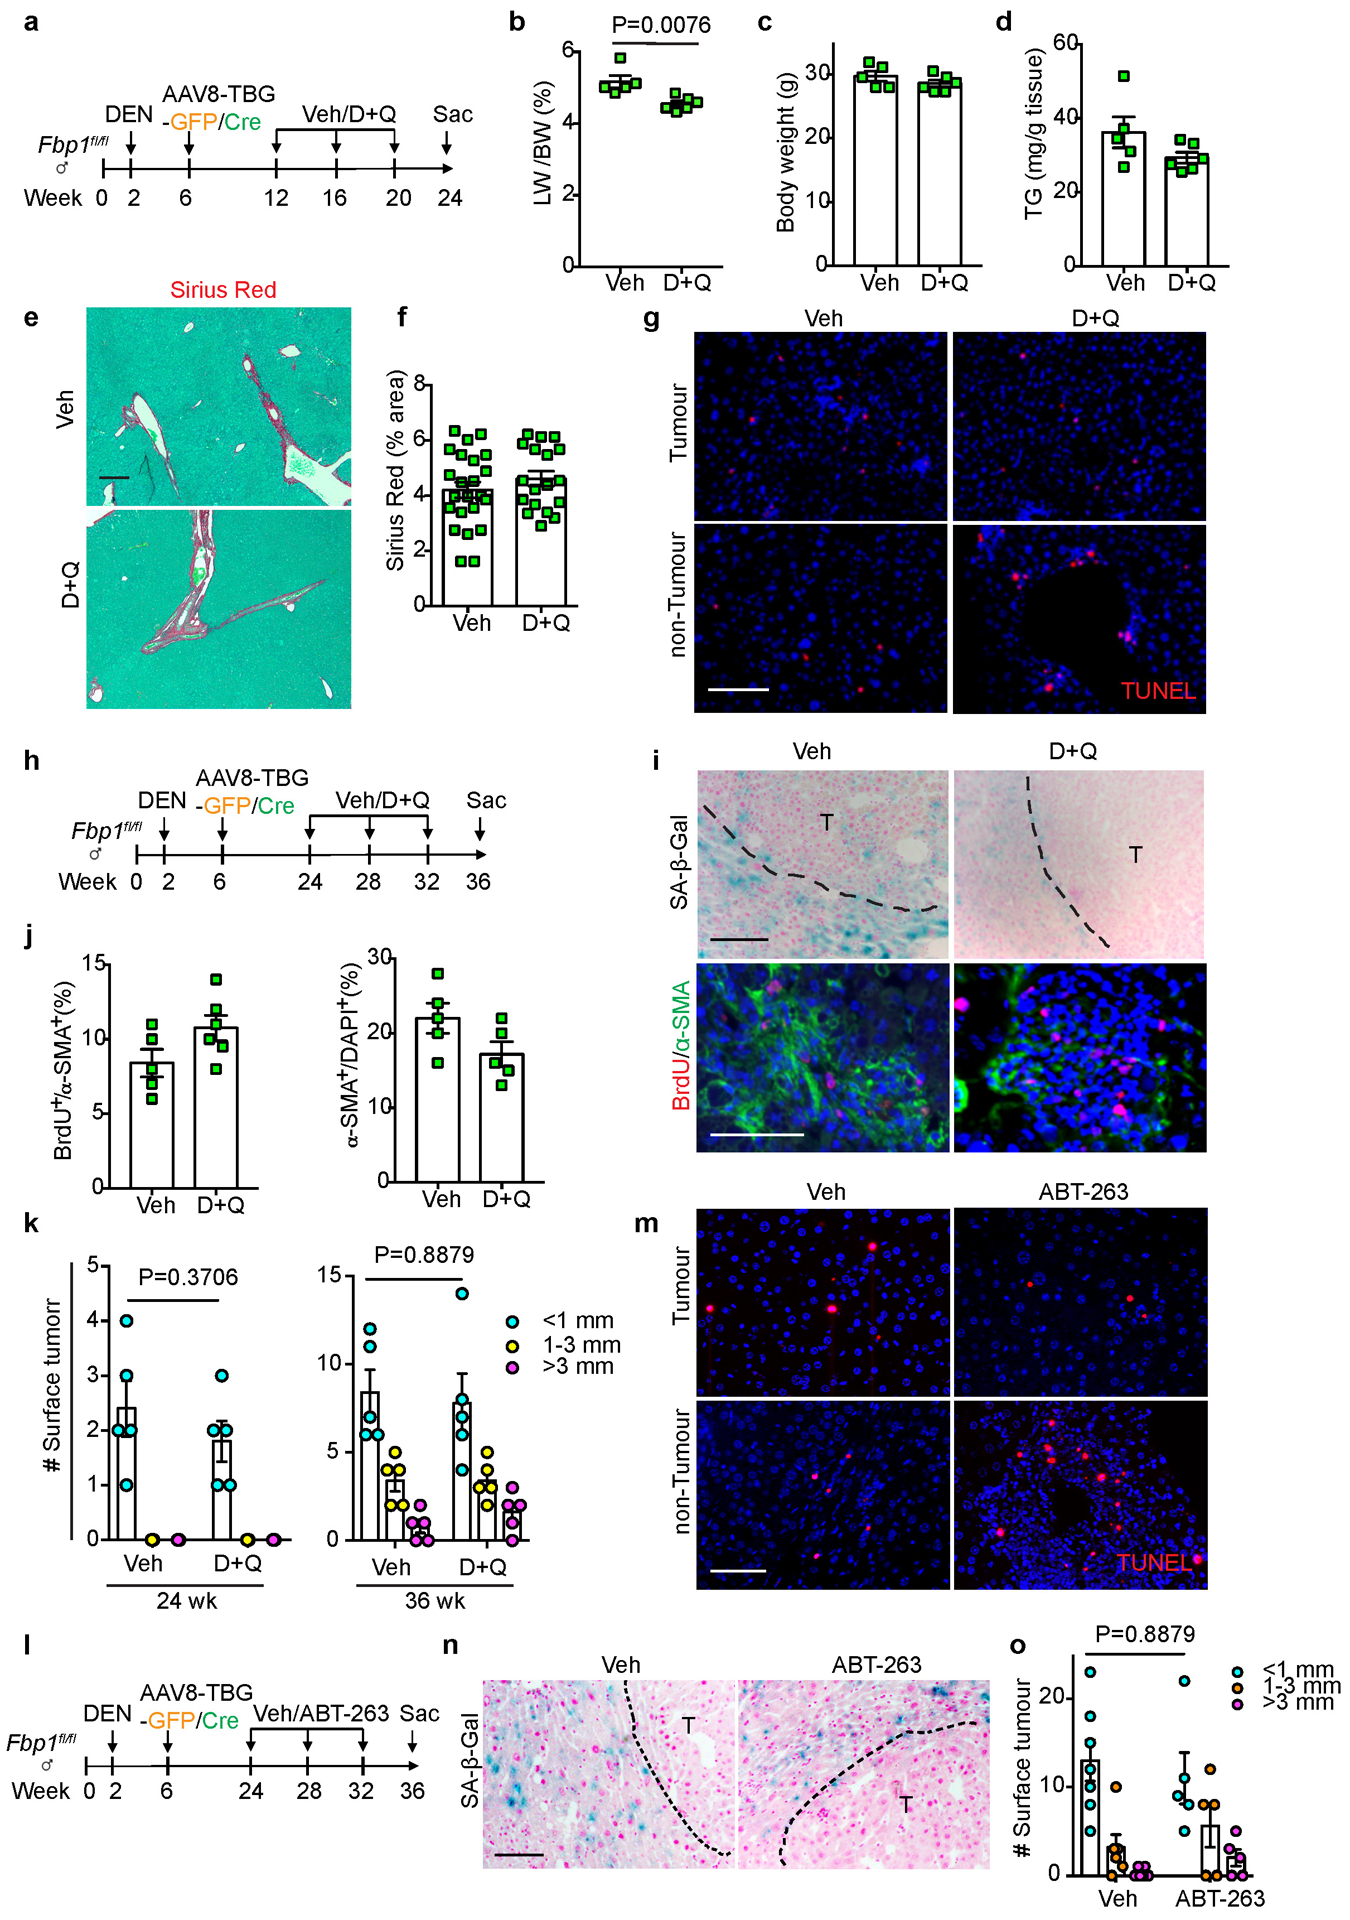
Extended Data Fig. 7. Characterizing the senolytic effects of D+Q and ABT-263 in vivo.

(a) Scheme of early stage Veh and D+Q treatment of DEN/GFP or DEN/Cre mice. (b, c) Liver-to-Body Weight (LW/BW) ratio (b) and body weight (c) quantifications of 24-week Veh (n=5) and D+Q (n=6) DEN/Cre mice. (d) Quantification of TG levels from 24-week Veh (n=5) and D+Q (n=6) DEN/Cre mouse livers. (e, f) Representative Sirius Red staining (e) and quantification (f) of 24-week Veh (n=25) and D+Q (n=20) DEN/Cre mouse liver sections. FOV: 200x fields of view. Scale bar: 100 μm. (g) TUNEL staining of 24-week Veh and D+Q DEN/Cre mouse liver sections (n=3 independent experiments). Scale bar: 100 μm. (h) Scheme of late stage Veh and D+Q treatment of DEN/GFP or DEN/Cre mice. (i) Representative SA-β-Gal staining (n=3 independent experiments), and BrdU/α-SMA IF staining of 36-week Veh and D+Q DEN/Cre mouse liver sections. Scale bar: 100 μm. (j) Quantification of BrdU and α-SMA IF staining of 36-week Veh (n=5) and D+Q (n=6) DEN/Cre mouse liver sections. (k) Surface tumour number and size distributions of 24 wk or 36 wk DEN/GFP mice treated with Veh or D+Q. n=5 mice for each cohort at each time point. (l) Scheme of Veh and ABT-263 treatment of DEN/GFP or DEN/Cre mice. (m) Representative TUNEL staining of 36-week Veh and ABT-263-treated DEN/Cre mouse liver sections (n=3 independent experiments). Scale bar: 100 μm. (n) SA-β-Gal staining of 36-week Veh and ABT-263-treated DEN/Cre mouse liver sections (n=3 independent experiments). Scale bar: 100 μm. (o) Surface tumour number and size distributions of DEN/GFP mice treated with Veh (n=5) or ABT-263 (n=5). Graphs in b-d, f, j, k and o show mean ± SEM, and P values were calculated using a two-tailed t-test. Numerical source data are provided in Scanned images of unprocessed blots in Source Data Extended Data Fig. 7.
