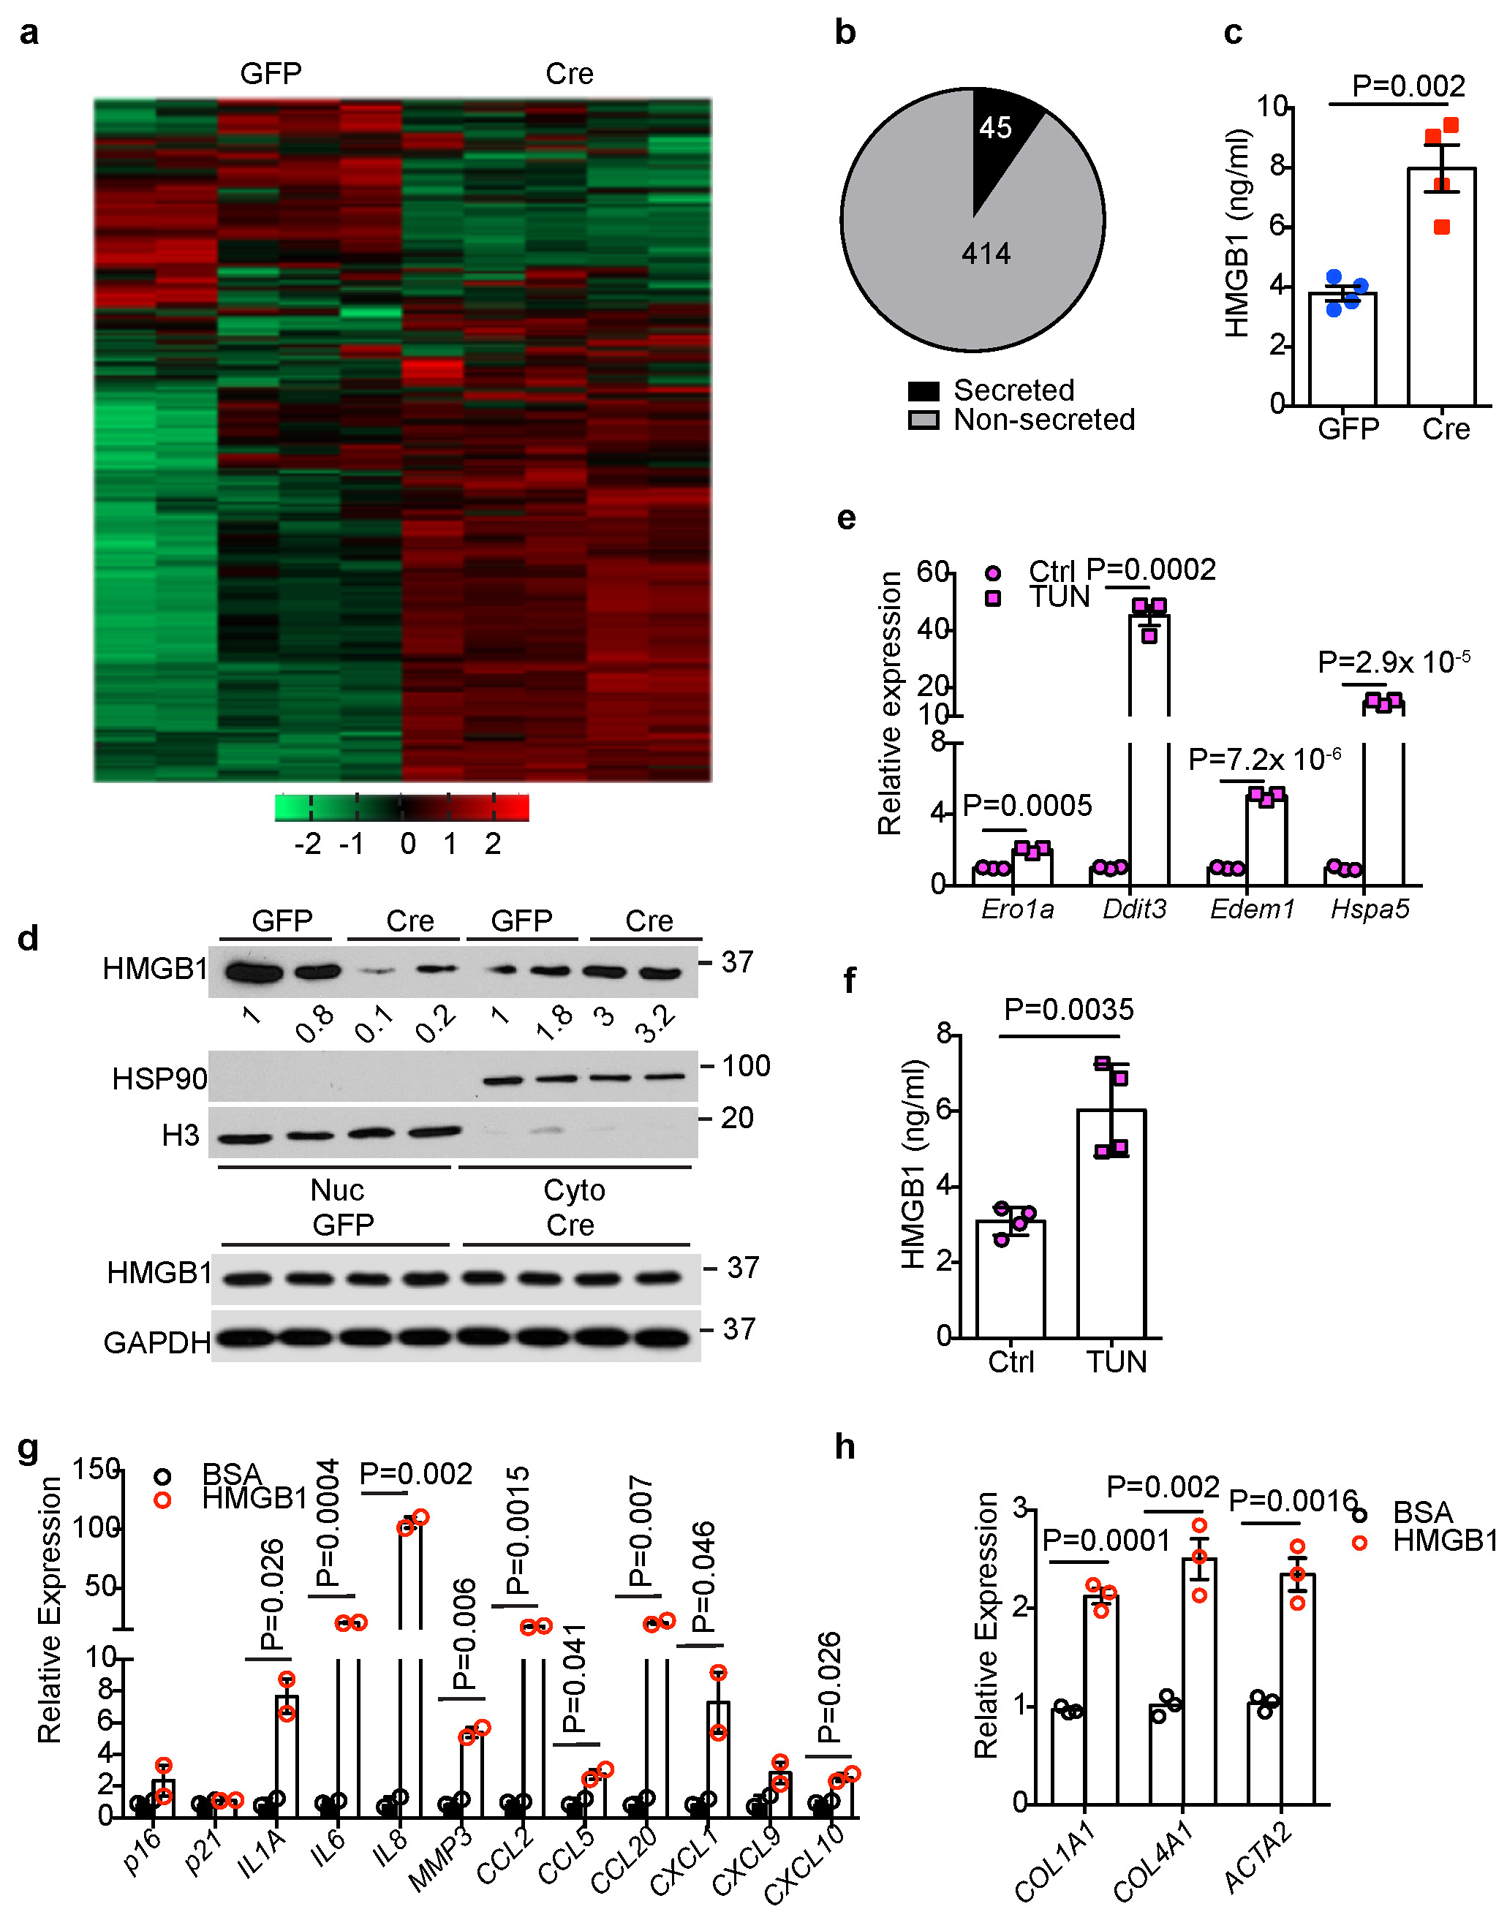
Extended Data Fig. 8. Identification of HMGB1 as a potential mediator between FBP1-deficient hepatocytes and HSCs.

(a) Unsupervised hierarchical clustering of normalized protein abundance in CM of 24-week Non-DEN GFP (n=5) and Cre (n=5) hepatocytes. (b) An Egyptian Pie Chart of 459 proteins with >=1.5-fold change (adjusted p<0.05) of abundance in CM between Non-DEN GFP (n=5) and Cre (n=5) groups. (c) ELISA-based quantification of HMGB1 levels in CM of 24-week Non-DEN GFP (n=4) or Cre (n=4) hepatocytes. (d) Immunoblotting analysis of HMGB1 in the nuclear (Nuc) and cytosolic (Cyto) fractions or total lysates from 24-week non-DEN GFP (n=2) and Cre (n=2) mouse livers. H3 and HSP90 were used as loading control for nuclear and cytosolic fractions, respectively. GAPDH was used as loading control for whole tissue lysates. (e) qRT-PCR analysis of UPR gene expression in mouse primary hepatocytes after tunicamycin (TUN) treatment (n=3 independent experiments). (f) ELISA-based quantification of HMGB1 levels in primary hepatocyte culture medium of Ctrl and TUN groups (n=3 independent experiments). (g, h) qRT-PCR analysis of SASP (g) or fibrotic (h) gene expression in human HSCs after 1 nM HMGB1 treatment for 15 h (n=3 independent experiments). Graphs in c, e, f-h show represent the mean ± SEM, and P values were calculated using a two-tailed t-test. Scanned images of unprocessed blots in d are shown in Source Data Extended Data Fig.8. Numerical source data are provided in Source Data Extended Data Fig. 8.
