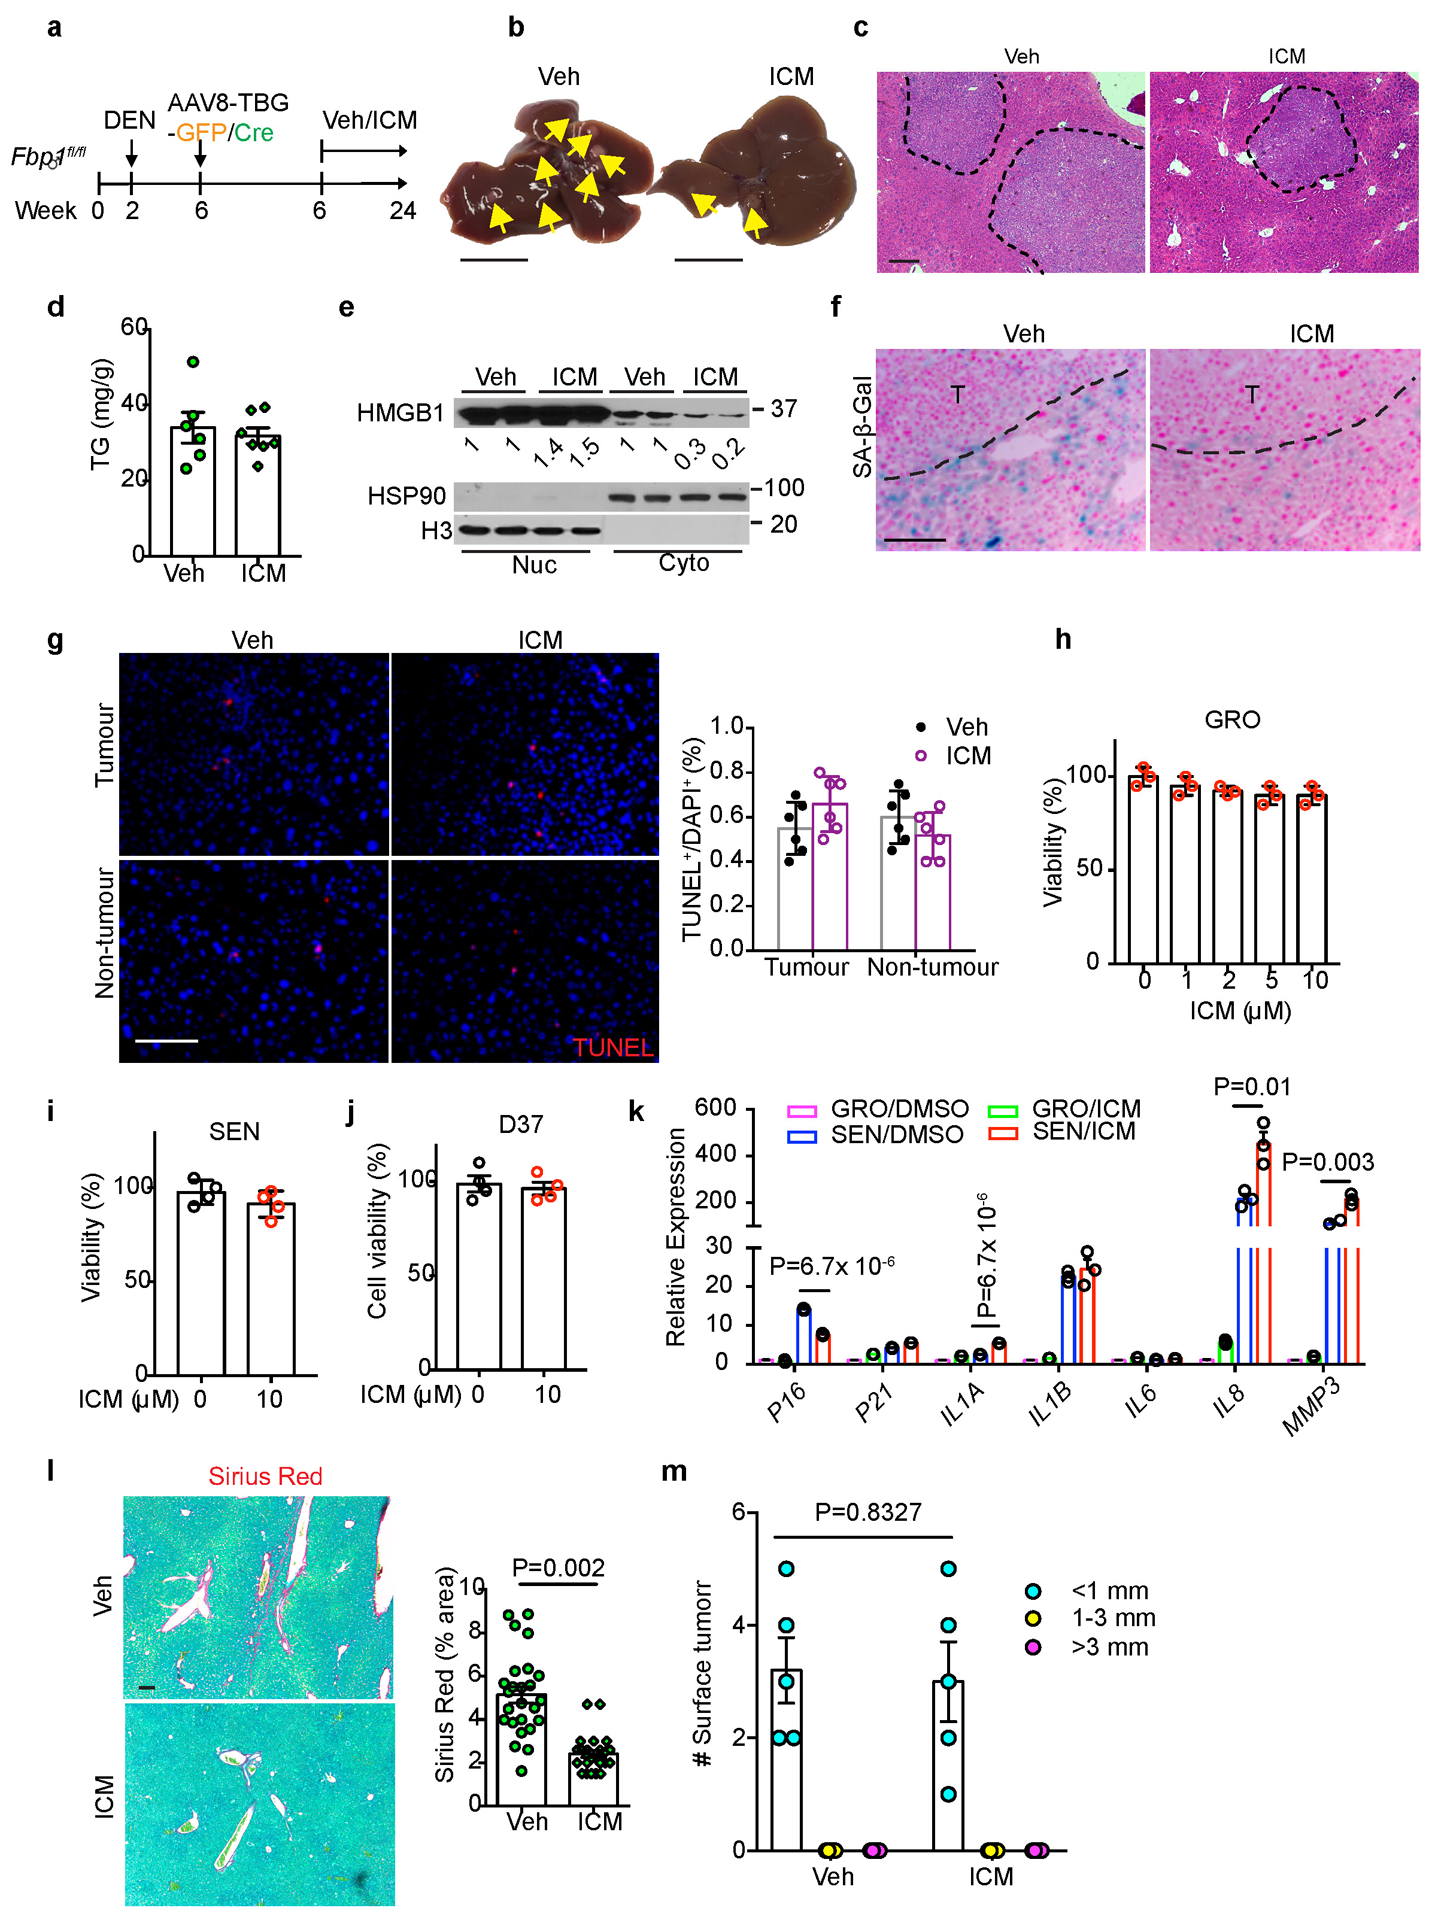
Extended Data Fig. 9. Characterization of in vivo and in vitro ICM treatment.

(a) Scheme for Veh and ICM treatment of DEN/GFP and DEN/Cre mice. (b) Gross liver appearances and tumour multiplicity (indicated by yellow arrows) in Veh and ICM DEN/Cre mice. Scale bar: 1 cm. (c) H&E staining of Veh (n=6) and ICM (n=7) DEN/Cre mouse liver sections. Scale bar: 100 μm. (d) Quantification of TG levels in Veh (n=6) and ICM (n=7) DEN/Cre mouse livers. (e) Immunoblotting analysis of HMGB1 in nuclear (Nuc) and Cytosolic (Cyto) fractions of Veh (n=2) and ICM (n=2) DEN/Cre livers. H3 and HSP90 were used as loading control for nuclear and cytosolic fractions, respectively. (f) SA-β-Gal staining of Veh (n=6) and ICM (n=7) DEN/Cre mouse liver sections. Scale bar: 100 μm. (g) TUNEL staining and quantification of Veh (n=6) and ICM (n=6) DEN/Cre mouse liver sections. Scale bar: 100 μm. (h) Cell viability assays of GRO human HSCs after ICM treatment (n=3 independent experiments). (I, j) Cell viability assays in SEN human HSCs (i) or mouse D37 cells (j) after ICM (10 μM) treatment (n=3 independent experiments). (k) qRT-PCR analysis of SASP gene expression in human HSCs after 10 μM ICM treatment for 24 h (n=3 independent experiments). (l) Representative Sirius Red staining and quantification (% area) of Veh (n=25 FOV) and ICM (n=21) DEN/Cre mouse liver sections. FOV: fields of view. Scale bar: 100 μm. (m) Quantification of surface tumour number and size distributions from DEN/GFP mice treated with Veh (n=5) or ICM (n=5). Graphs in d, g-m show mean ± SEM, and P values were calculated using a two-tailed t-test. Scanned images of unprocessed blots in e are shown in Source Data Extended Data Fig.9. Numerical source data are provided in Source Data Extended Data Fig. 9.
