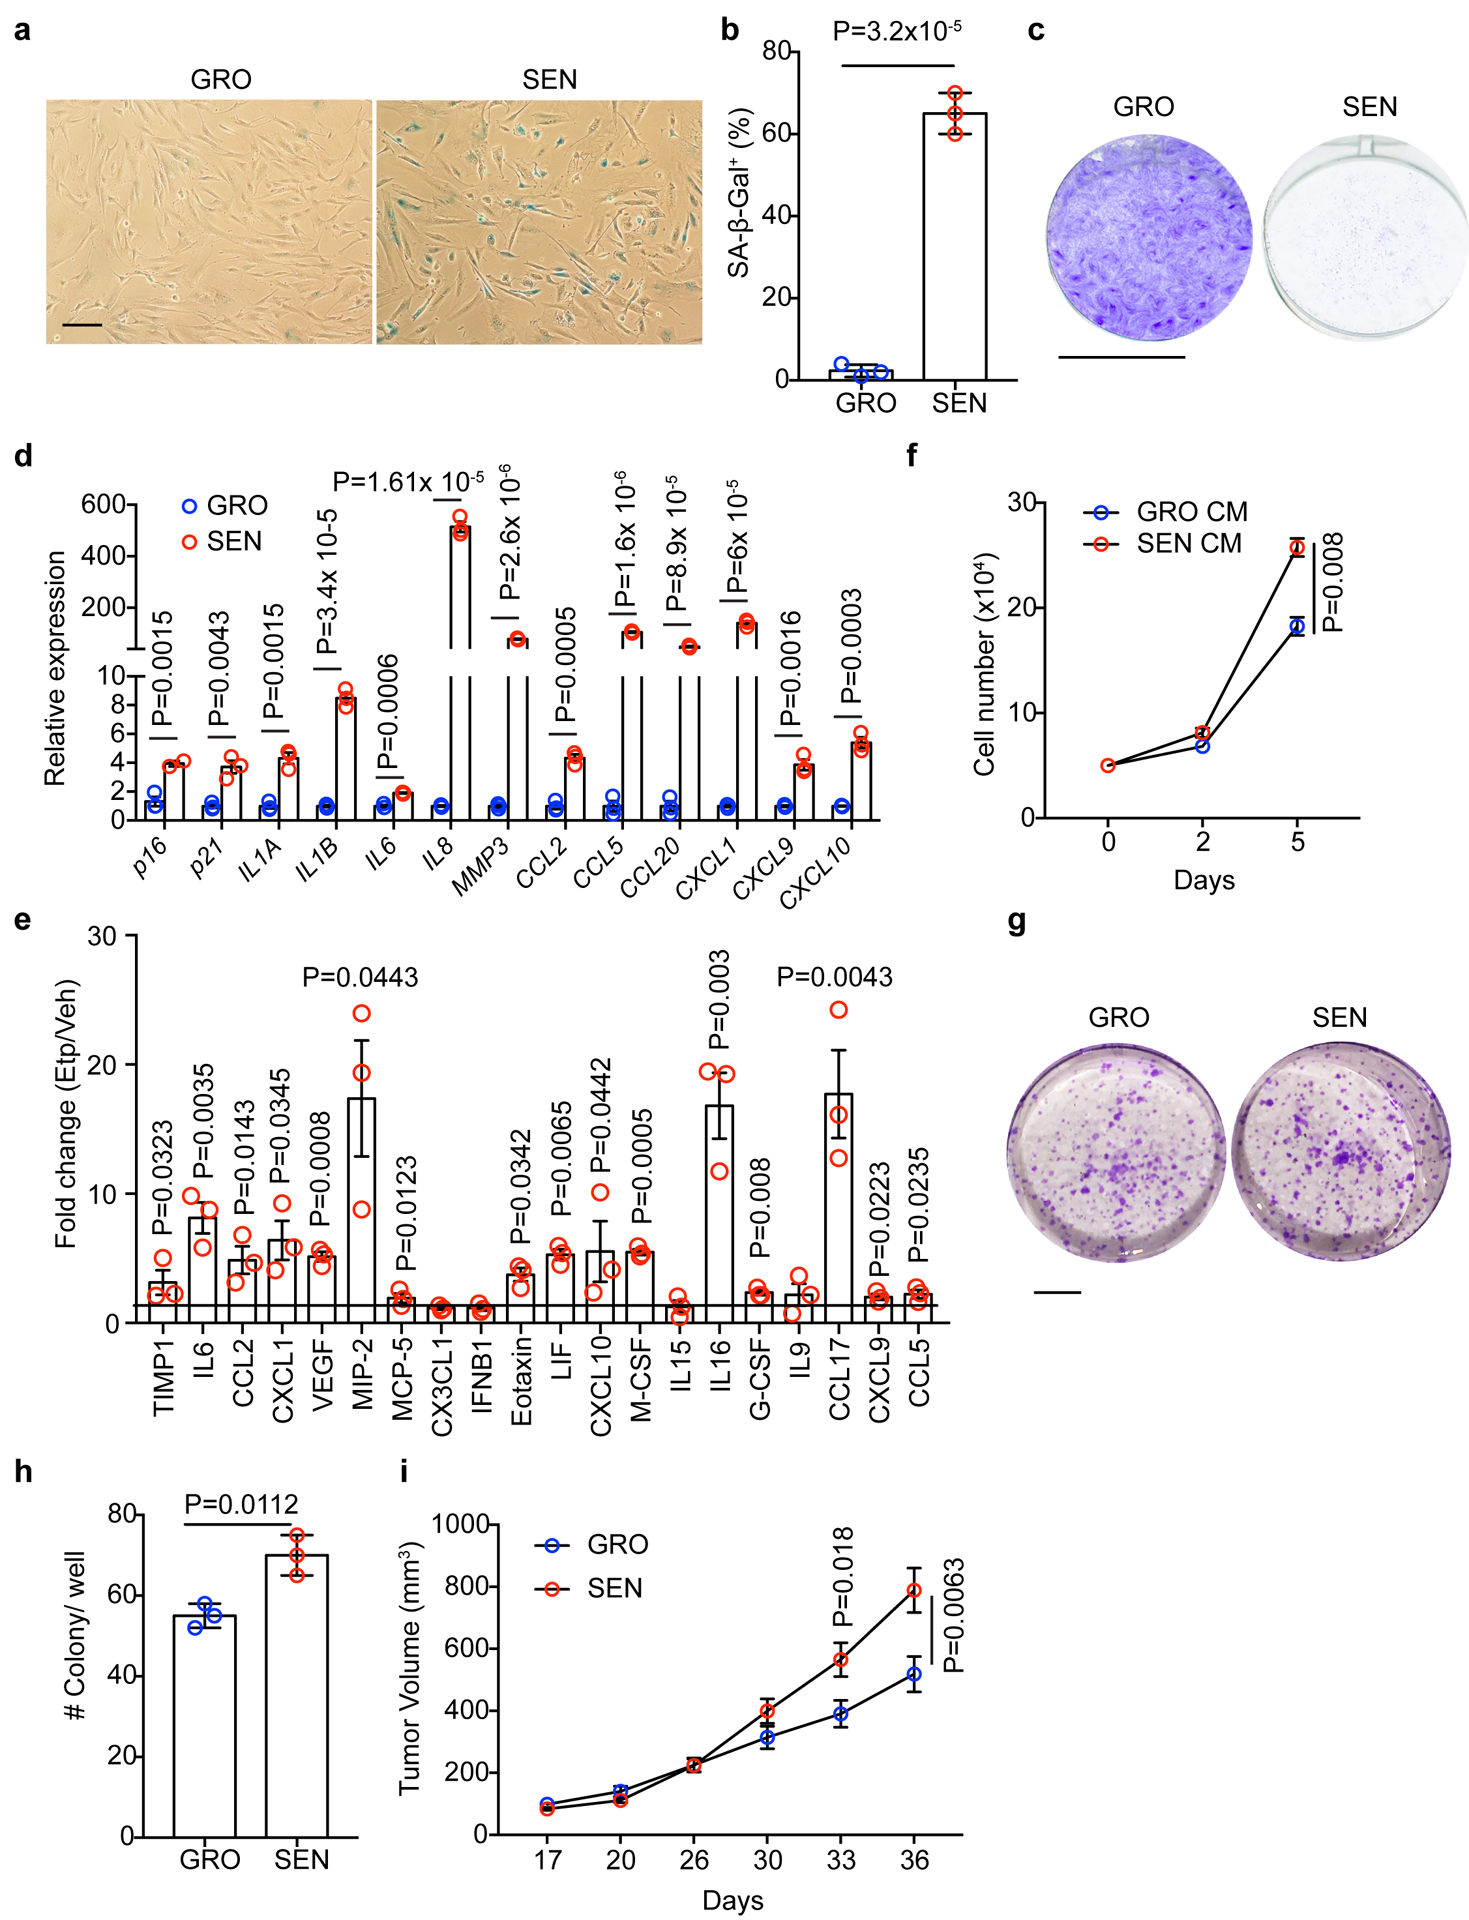
Figure 5 |. Senescent HSCs promote HCC growth in vitro and in vivo.

a, b, SA-β-Gal staining (a) and quantification (% of cells) (b) of GRO and SEN human HSCs (n = 3 independent experiments). Scale bar: 100 μm. c, Proliferation assay for GRO and SEN HSC cells (n = 3 independent experiments). Scale bar: 1 cm. d, Gene expression by qRT-PCR analysis of GRO and SEN human HSCs (n = 3 independent experiments). e, Cytokine array of conditioned medium (CM) from vehicle (Veh) control and etoposide (Etp)-treated mouse HSCs. The abundance of individual protein of Etp groups was normalized to that of Veh group and expressed as fold change. n=3 for each group. f, In vitro cell proliferation assay for human PLC HCC cells cultured in CM from GRO or SEN human HSCs (n = 3 independent experiments). g, h, Clonogenicity assay (g) and quantification (h) of PLC HCC cells in CM from GRO or SEN human HSCs (n = 3 independent experiments). Scale bar: 1 cm. i, Xenograft tumor growth assay with PLC cells and co-injected GRO or SEN human HSCs. n=15 tumours in each group. Graphs in b, d, e, f, h and i show mean ± SEM, and P values were calculated using a two-tailed t-test. Numerical source data are provided in Statistic Source Data Fig. 5.
