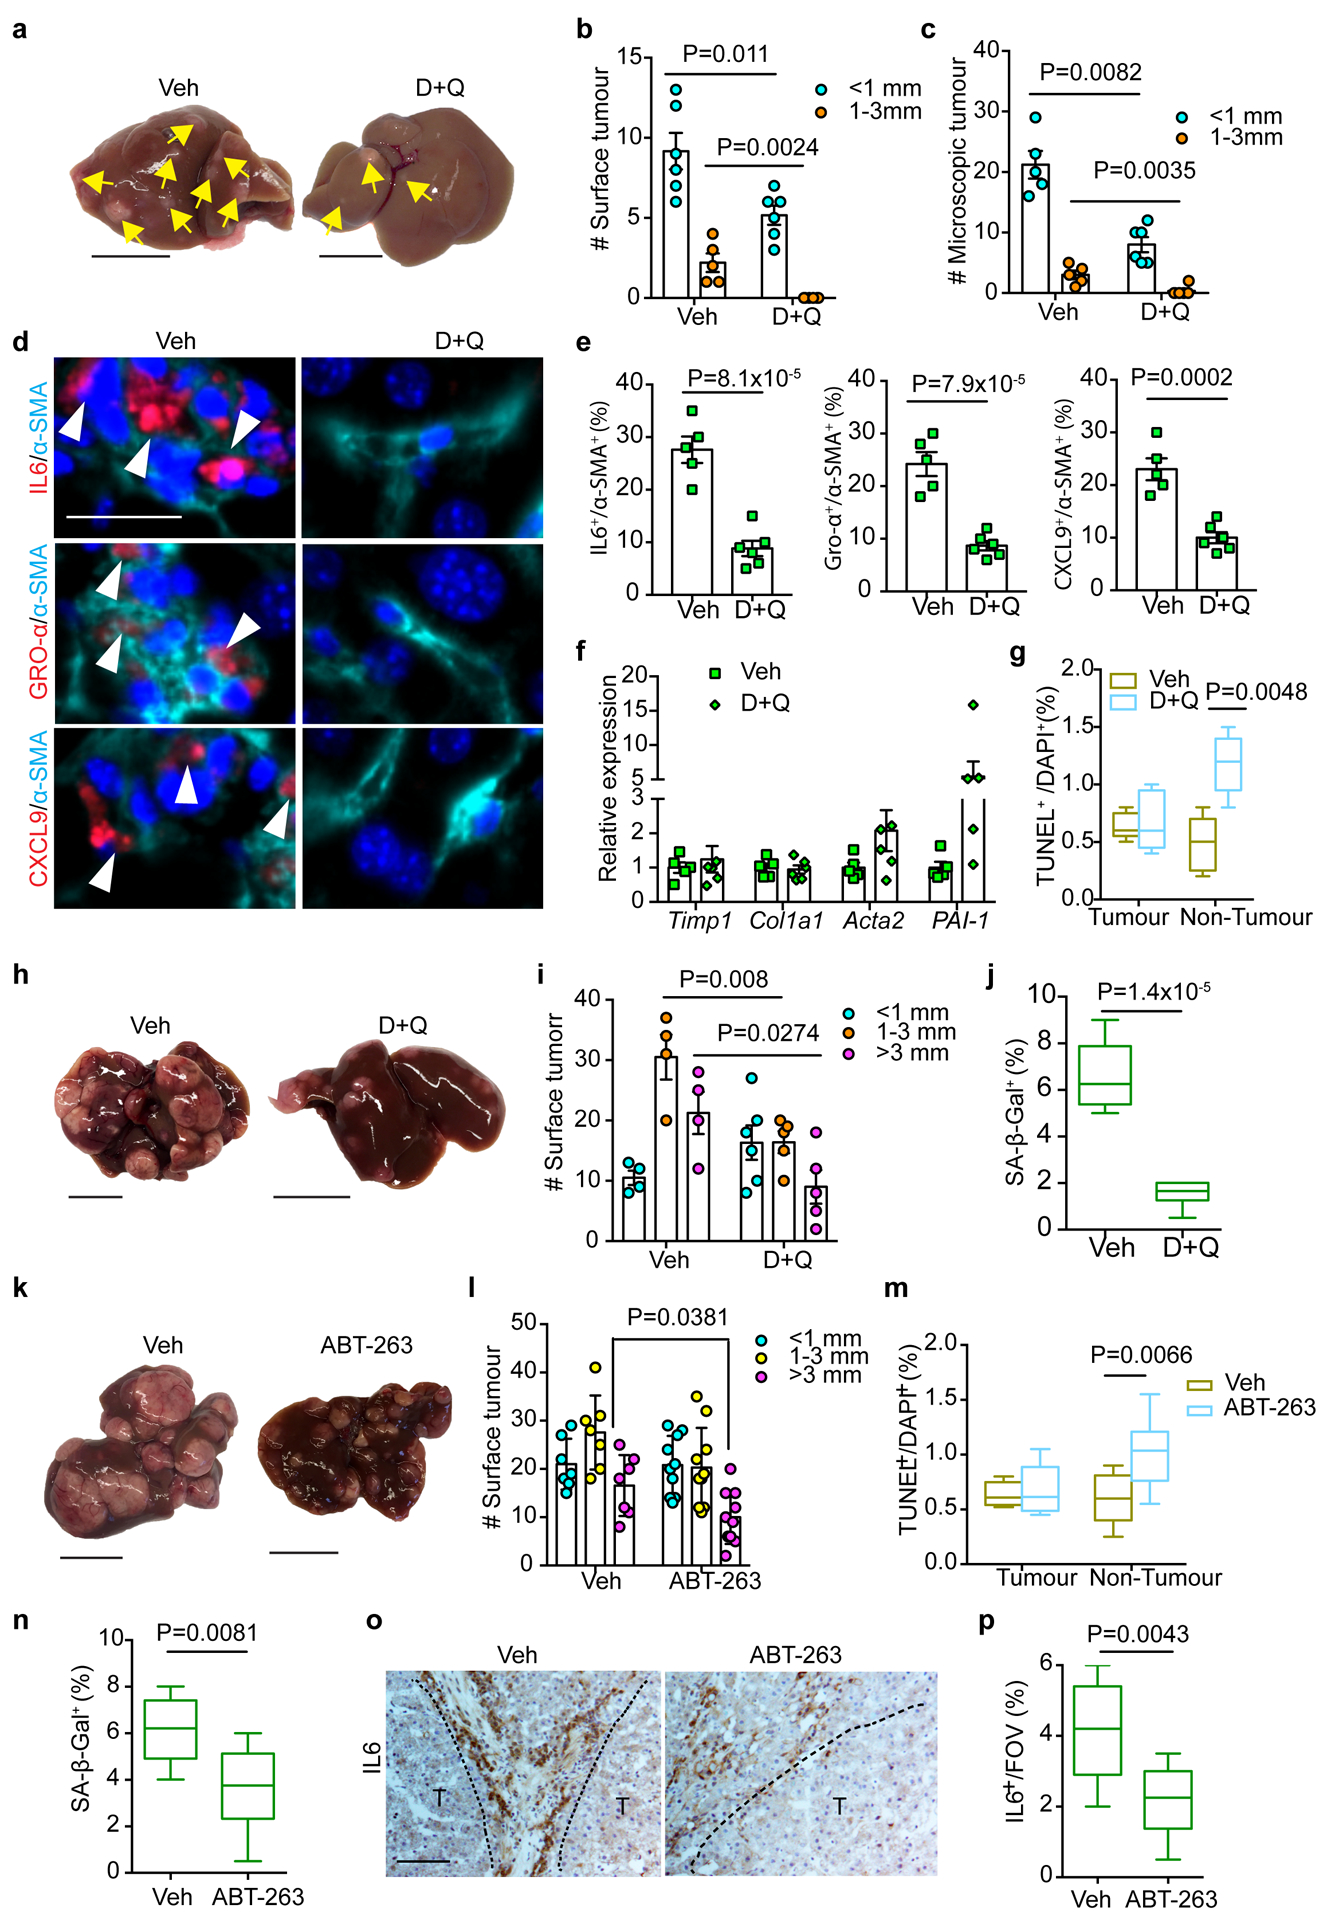
Figure 6|. Senolytic treatment limits HSC SASP and tumour progression driven by FBP1 loss.

a, Gross liver appearance and tumour multiplicity (indicated by yellow arrows) in 24-week Veh and D+Q DEN/Cre cohorts. Scale bar: 1 cm. b, c, Surface (b) and microscopic (c) tumour number and size distributions in 24-week Veh (n=5) and D+Q (n=6) DEN/Cre cohorts. d, e, IF staining (d) and quantification (e) of IL6+/α-SMA+, GRO-α+/α-SMA+ and CXCL9+/α-SMA+ cells in 24-week Veh (n=5) and D+Q (n=6) DEN/Cre mouse liver sections. Scale bar: 50 μm. f, qRT-PCR analysis of fibrotic gene expression from 24-week Veh (n=5) and D+Q (n=5) DEN/Cre mouse livers. g, Quantification of TUNEL staining from 24-week Veh (n=5) and D+Q (n=6) DEN/Cre liver sections. h, Gross liver appearances and tumour multiplicity in 36-week Veh and D+Q DEN/Cre mice. Scale bar: 1 cm. i, Surface tumour number and size distributions in 36-week Veh (n=4) and D+Q (n=5) DEN/Cre cohorts. j, Quantification of SA-β-Gal staining of 36-week Veh (n=4) and D+Q (n=5) DEN/Cre mouse liver sections. k, Gross liver appearances and tumour multiplicity in 36-week Veh and ABT-263 DEN/Cre cohorts. Scale bar: 1 cm. l, Surface tumour number and size distributions in 36-week Veh (n=7) and ABT-263 (n=10) DEN/Cre mice. m, Quantification of TUNEL staining from 36-week Veh (n=7) and ABT-263 (n=10) DEN/Cre mouse liver sections. n, SA-β-Gal staining quantification of 36-week Veh (n=7) and ABT-263 (n=10) DEN/Cre mouse liver sections. o, p, Representative IL6 IHC staining (o) and quantification (p) of 36-week Veh (n=7) and ABT-263 (n=10) mouse liver sections. T, tumour. Scale bar: 100 μm. In box plots of g, j, m, n and p, the top-most line is the maximum, the top of the box is the upper quartile, the centre line is the median, the bottom of the box is the lower quartile and the bottom-most line is the minimum. Graphs in b, c, e, f, i and l show mean ± SEM. All P values were calculated using a two-tailed t-test. Numerical source data are provided in Statistic Source Data Fig. 6.
