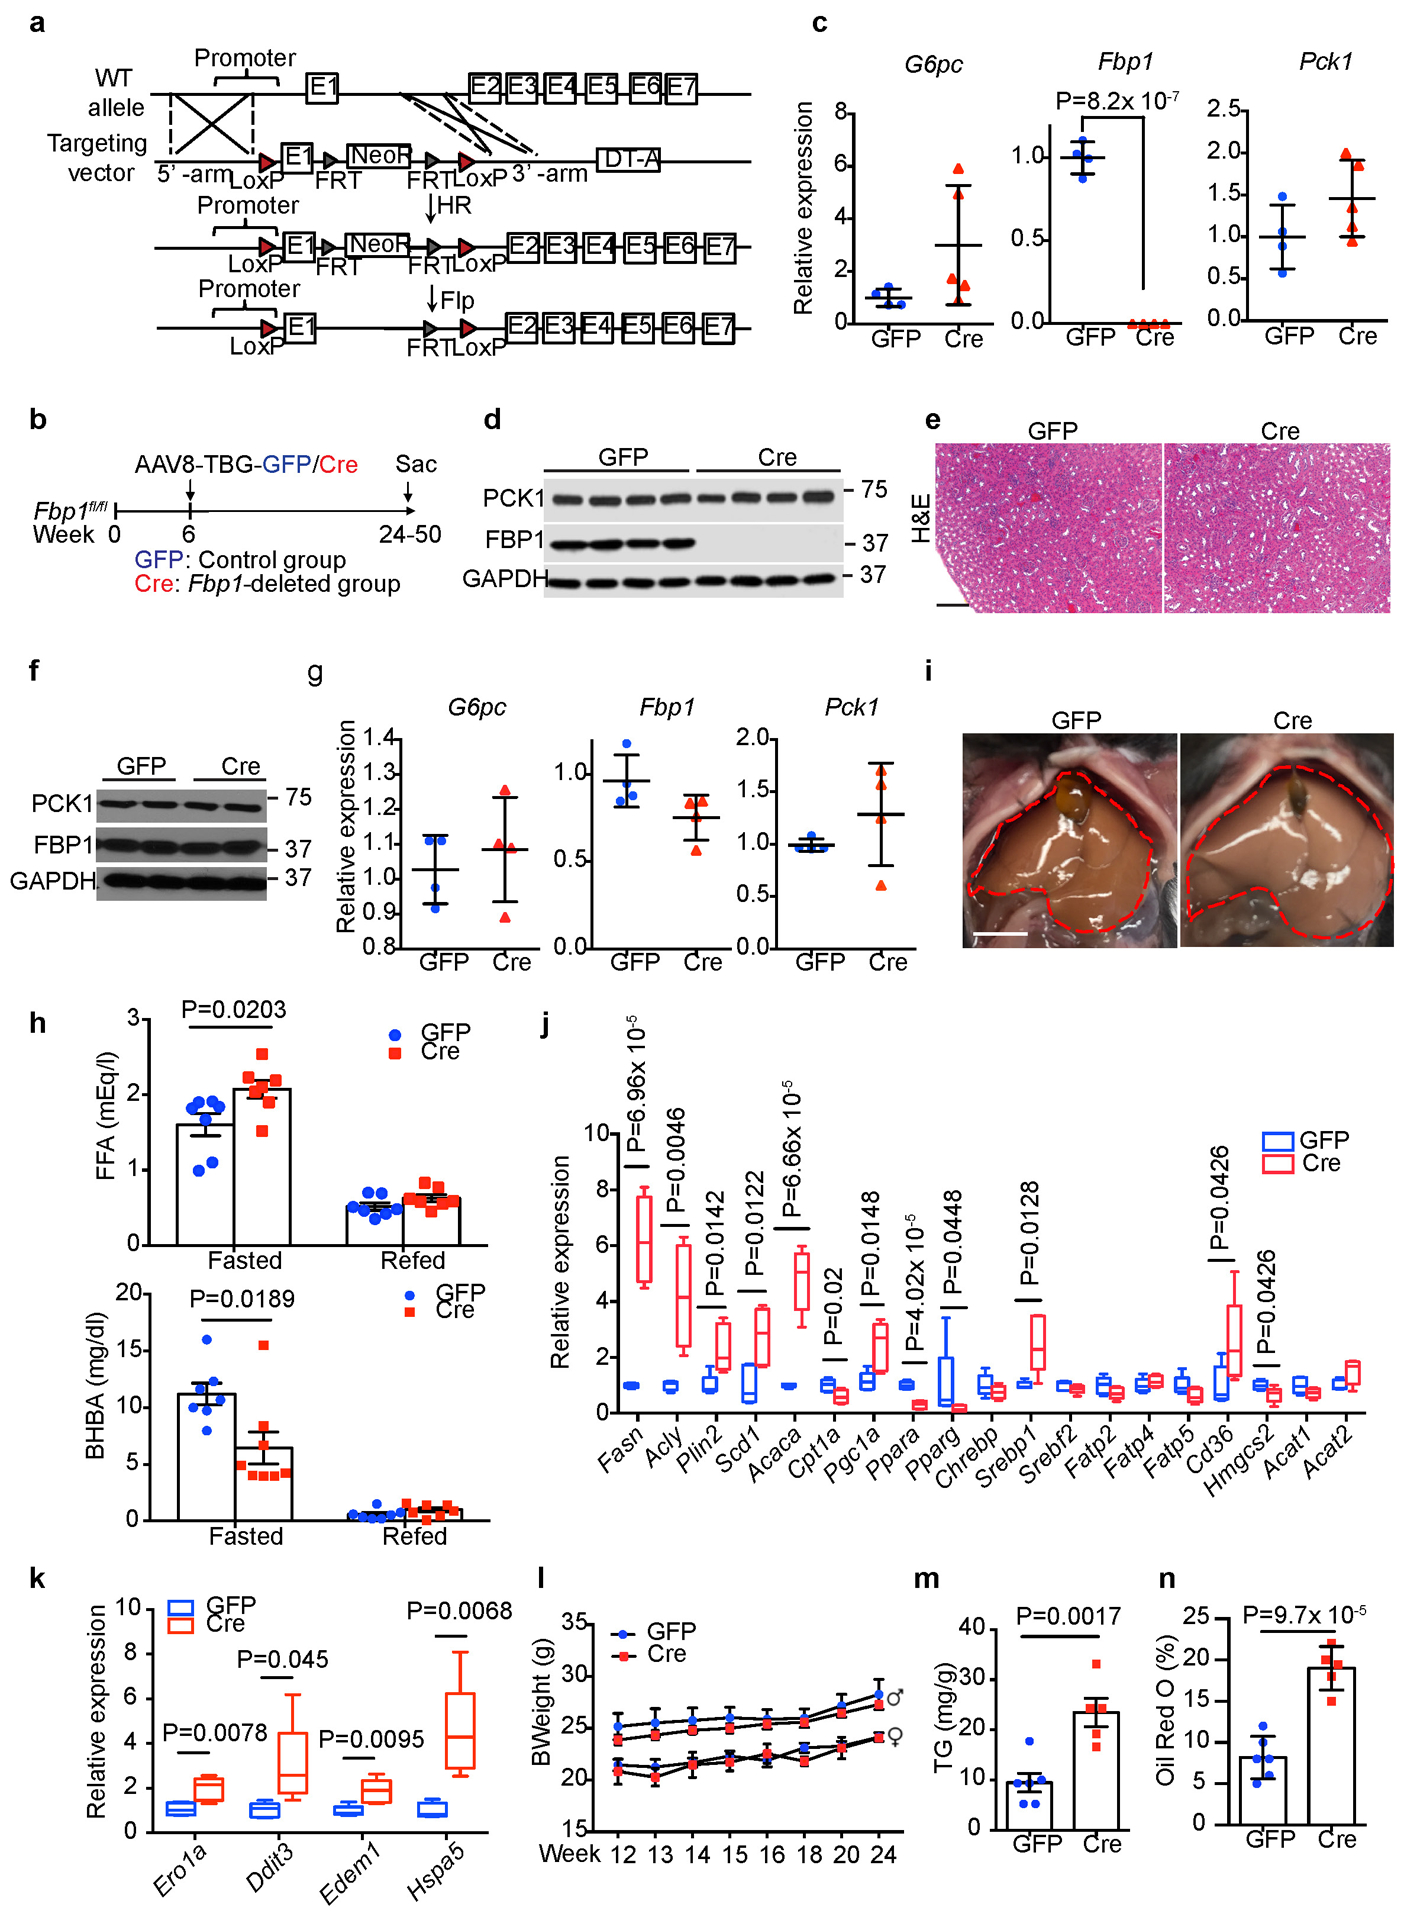
Extended Data Fig. 2. Hepatic FBP1 loss disrupts liver metabolism in mice.

(a) Scheme for generating Fbp1fl/fl mice by homologous recombination. (b) Scheme for hepatocyte-specific Fbp1 deletion in Fbp1fl/fl mice. (c) qRT-PCR analysis of gluconeogenic gene expression in 24-week GFP (n=4) and Cre (n=4) livers. (d) Immunoblotting analysis of 24-week GFP and Cre livers (n = 3 independent experiments). GAPDH was used as loading control. (e) H&E staining of 24-week GFP and Cre kidney sections (n = 3 independent experiments). Scale bar: 100 μm. (f) Immunoblotting analysis of 24-week GFP (n=2) and Cre (n=2) kidneys. GAPDH was used as loading control. (g) qRT-PCR analysis of gluconeogenic gene expression in 24-week GFP (n=4) and Cre (n=4) kidneys. (h) Serum free fatty acid (FFA) and β-hydroxybutyrate (BHBA) levels of fasted (16-h) and refed (4-h) GFP (n=7) and Cre (n=8) mice (24-week). (i) Liver gross appearance of 16-h fasted animals (24-week) (n = 3 independent experiments). (j, k) qRT-PCR analysis of lipid metabolism (j) and unfolded protein response (UPR) (k) gene signatures in 16-h fasted GFP (n=5) and Cre (n=5) livers (24-week). In each box plot, the top-most line is the maximum, the top of the box is the third quartile, the centre line is the median, the bottom of the box is the first quartile and the bottom-most line is the minimum. (l) Growth rates of GFP and Cre mice. GFP: n=5 for female or male mice, Cre: n=5 for female, n=8 for male mice. (m, n) Quantification of triglyceride (TG) (m) and Oil Red O staining (% area) (n) in 24-week GFP (n=6) and Cre (n=5) mouse livers. Graphs in c, g, h, l-n show mean ± SEM. All P values were calculated using a two-tailed t-test. Scanned images of unprocessed blots in c and e are shown in Source Data Extended Data Fig.2. Numerical source data are provided in Source Data Extended Data Fig. 2.
