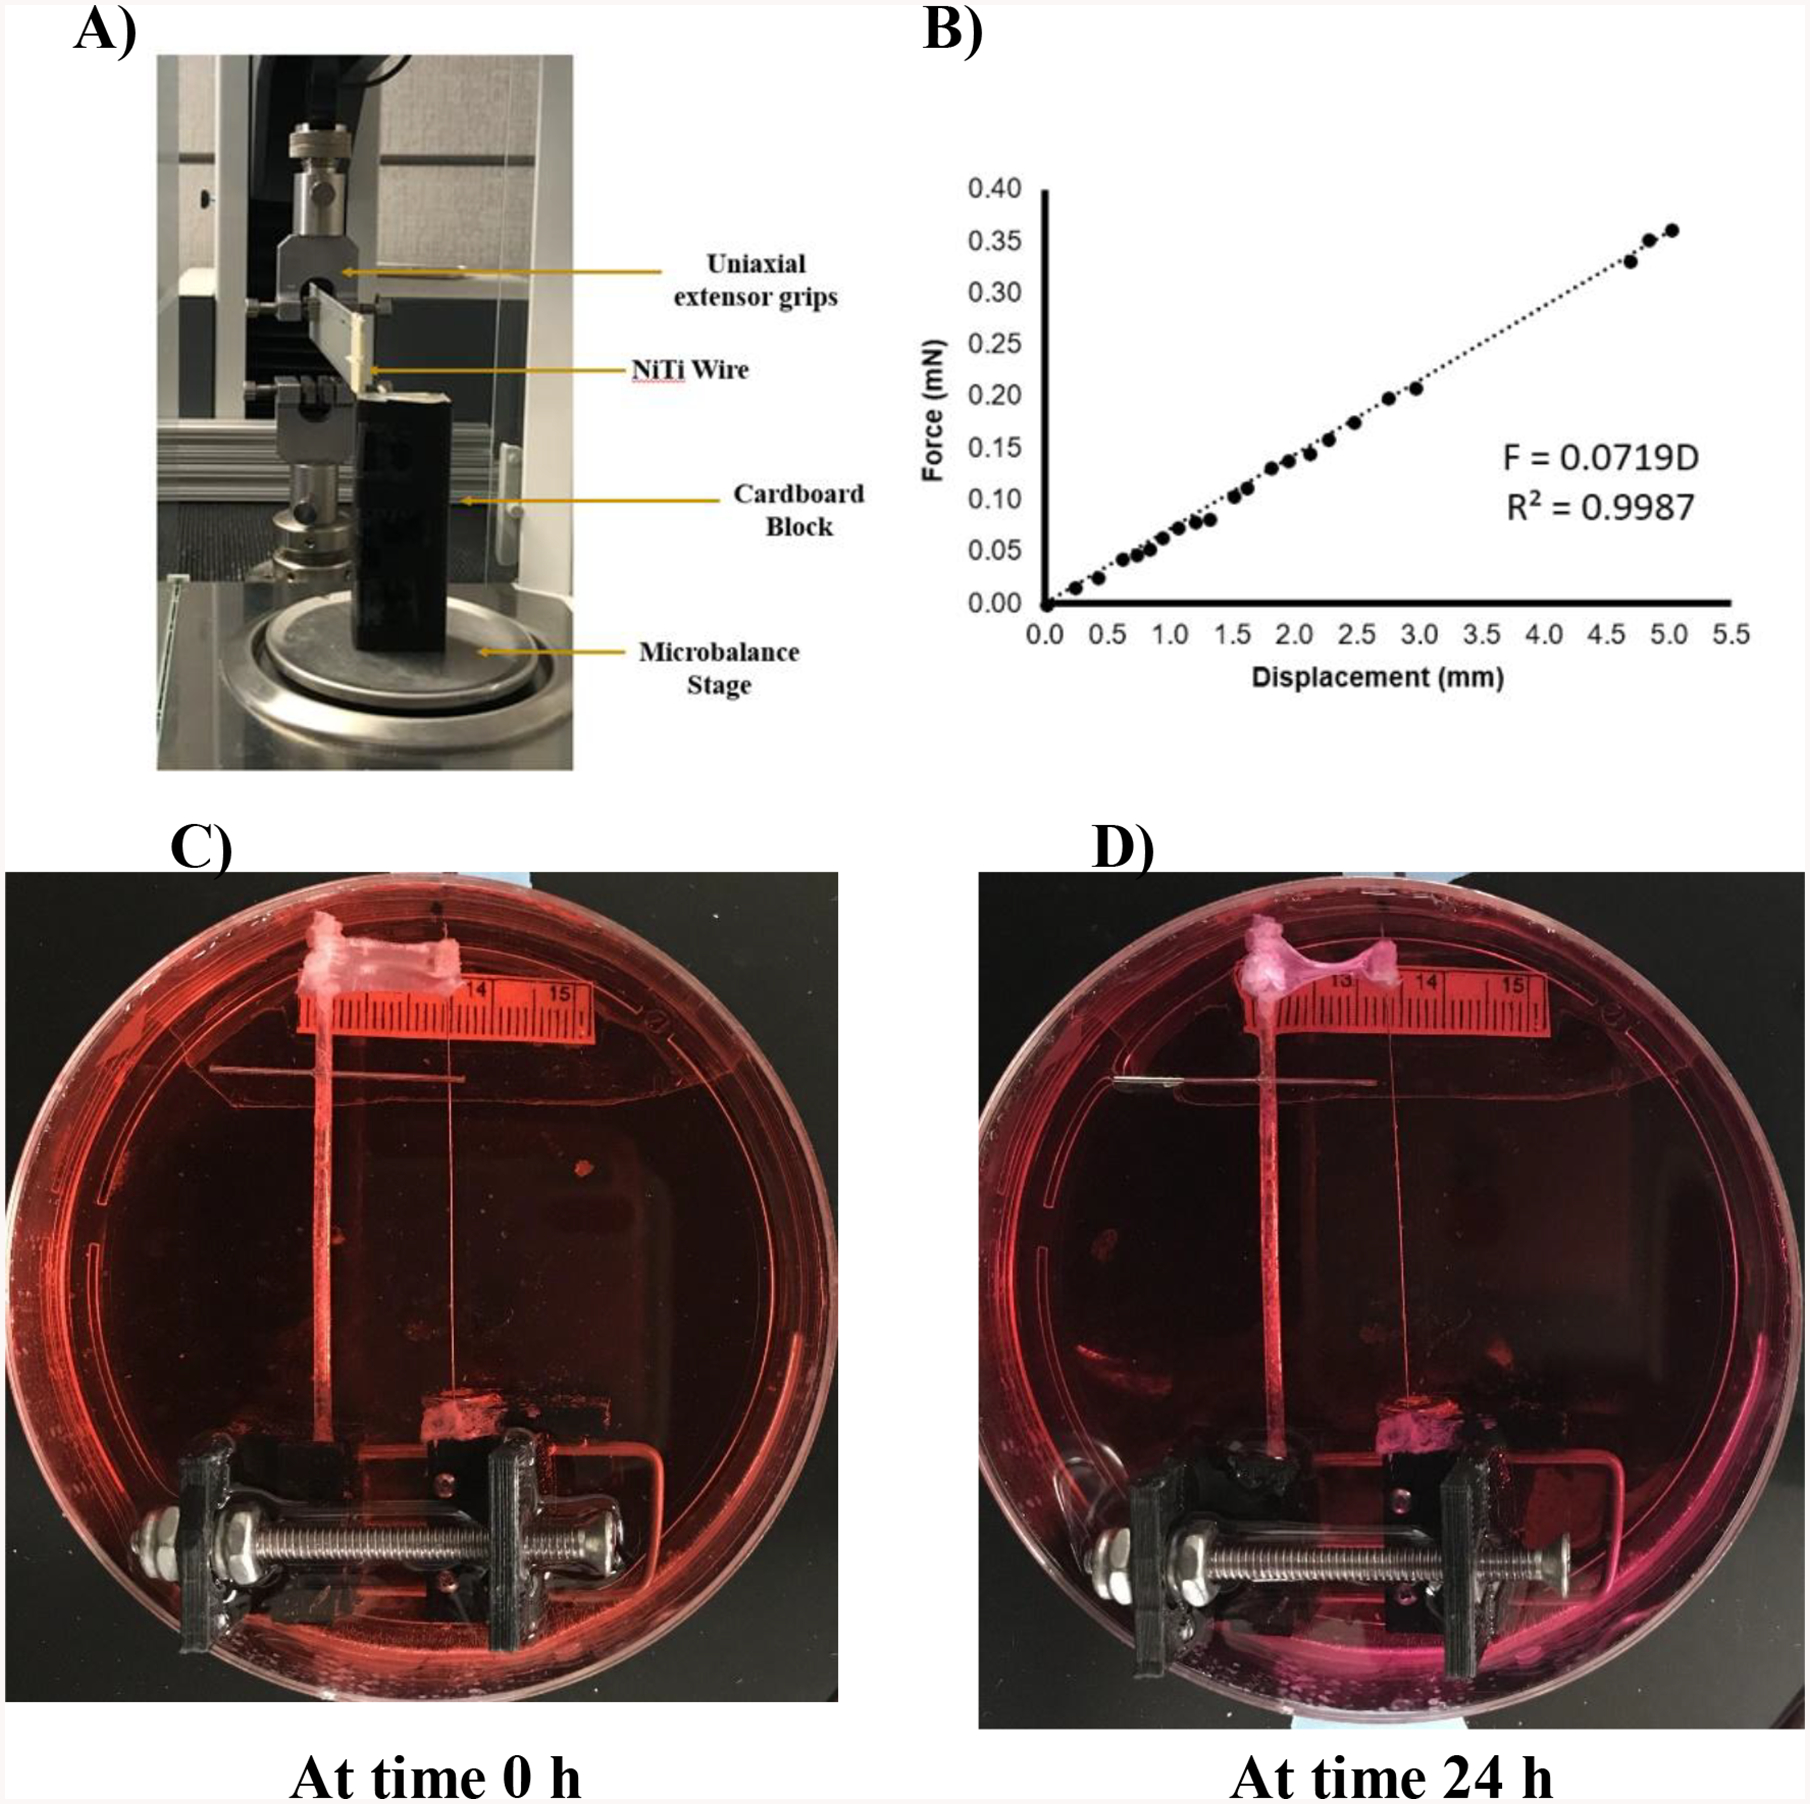
Figure 6:

Top A) Figure showing the process of calibration of a NiTi wire using a microbalance. B) Graph showing the calibration plot of NiTi wire via measurement of force with respect to displacement. Bottom figures showing the process of measuring force exerted by human TERT fibroblasts seeded on DTS and transferred onto the rigid rod/NiTi wire system after 6 h of seeding cells. C) At time 0 h after transferring cell seeded DTS. D) At time 24 h after transferring cell seeded DTS. Approximately 1 mm displacement in NiTi wire was observed equating to the force exertion of approx. 72 nN/30,000 cells or 2.4 pN per cell.
