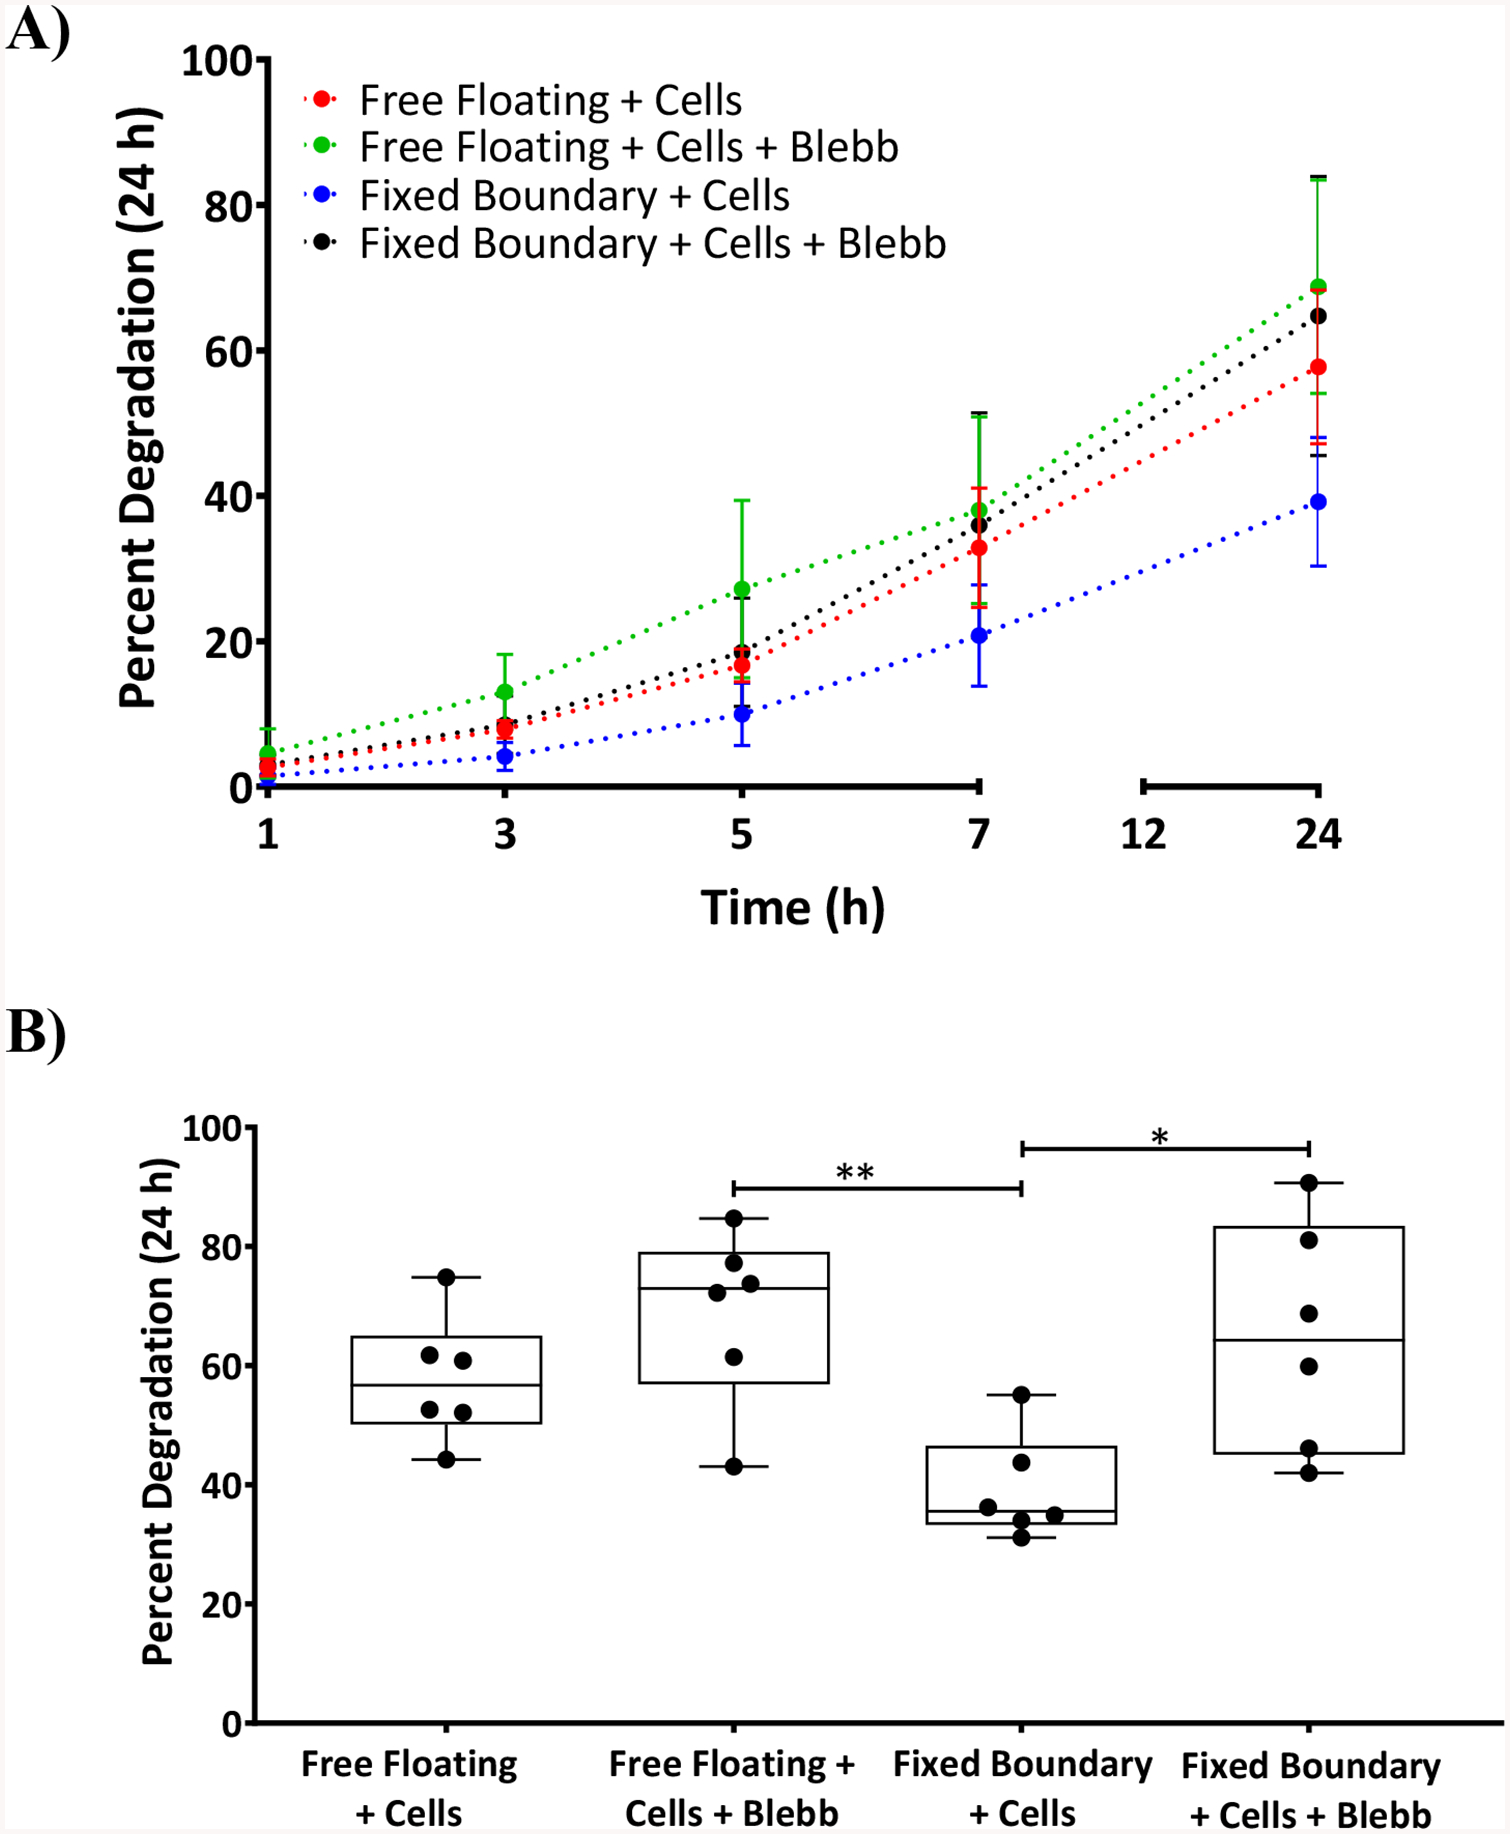
Figure 7:

A) Graph showing the percent degradation of ECMs after cell contractile force exertion with fixed boundary conditions and free floating in the presence and absence of blebbistatin at time points 1, 3, 5, 7, and 24 h. B) For the sake of clarity, the same 24 h data point as shown in Figure 7 A was represented in a bar graph showing the percent degradation of DTS that are subjected to free floating and fixed boundary conditions and treated or untreated with blebbistatin. Statistical analysis was performed using a one-way ANOVA and Tukey post hoc test with n=6. *p<0.05, **p<0.01
