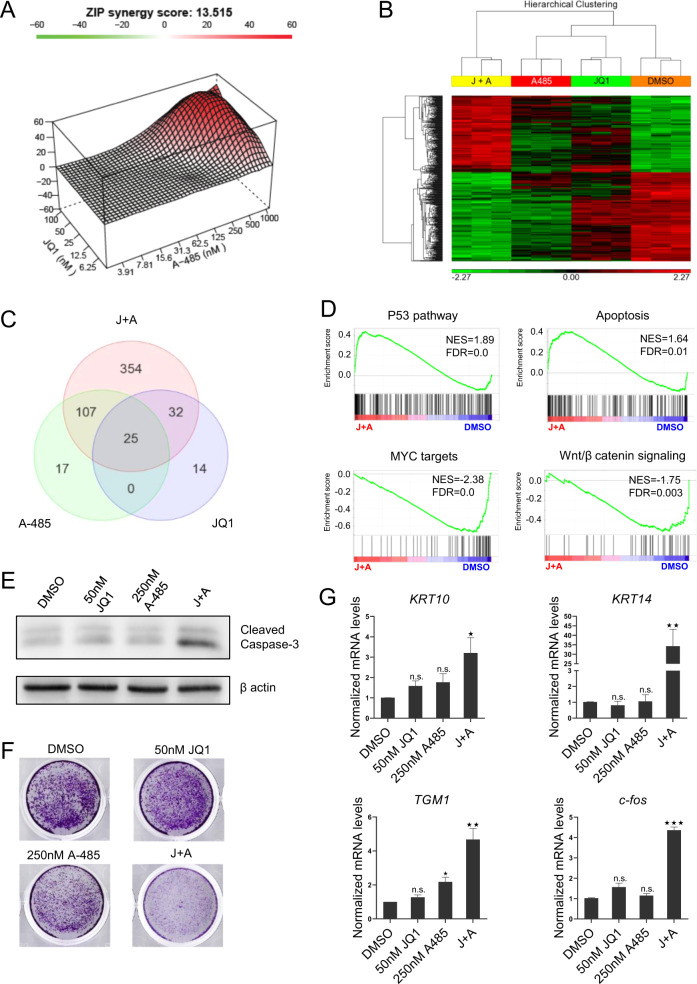
Fig. 4. P300/CBP and BET inhibition have synergistic effects in NMC.
a Combination response to A-485 and JQ1 for HCC2429 cells. CellTiterGlo cell viability assay was performed to measure cell viabilities of all the indicated dose combinations for 72 h. Synergy effects were evaluated using SynergyFinder (https://synergyfinder.fimm.fi). The ZIP synergy score is averaged over all the dose combination cells. b,c Hierarchical clustering (b) and Venn diagram analysis (c) of the differentially expressed genes in HCC2429 cells treated with 50 nM JQ1 and 250 nM A-485 alone or combined for 8 h. Each treatment was done in triplicate. d Representative GSEA plots showing significantly enriched up- and downregulated pathways (combination-treatment versus DMSO). e Immunoblot analysis of cleaved caspase-3 in HCC2429 cells incubated with 50 nM JQ1 and 250 nM A-485 alone or combined for 72 h. f Colony formation assay for HCC2429 cells incubated with 50 nM JQ1 and 250 nM A-485 alone or combined for 72 h. g Quantitative RT-PCR analysis of squamous tissue genes (KRT10, KRT14 and TGM1) and c-fos in HCC2429 cells incubated with 50 nM JQ1 and 250 nM A-485 alone or combined for 5 days. Mean ± SEM from three independent experiments, ***P ≤ 0.001, **P ≤ 0.01, *P ≤ 0.05; n.s., not significant.

