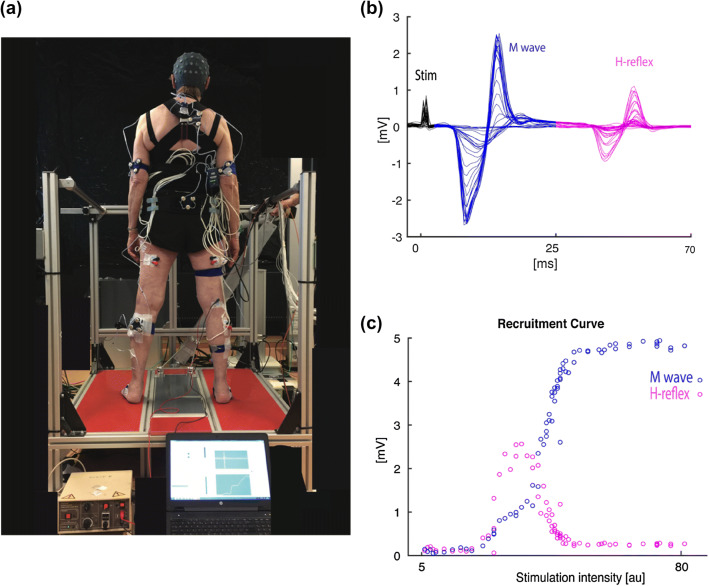
Fig. 1.
a Experimental setup, showing a participant in bipedal stance, receiving electrical stimulation to establish the recruitment curve. b Time series of the EMG response of the soleus muscle to the stimulation, showing traces at different stimulus intensities, each with a stimulus artifact (Stim), an M wave, and an H-reflex. c Recruitment curves, showing peak-to-peak values of M waves and H-reflexes as a function of stimulus intensity

