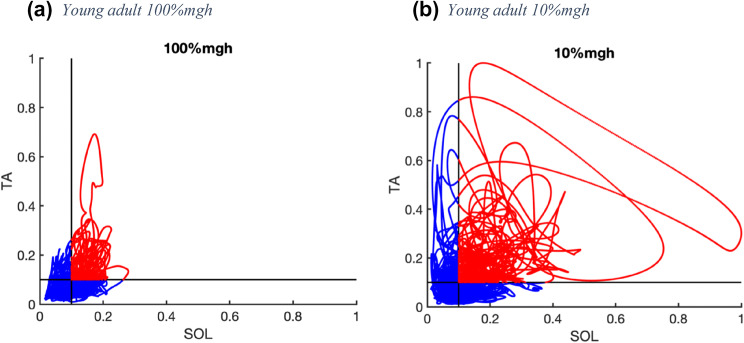
Fig. 4.
Co-contraction; results are displayed as scatter plots of tibialis anterior (TA, y-axis) and soleus (SOL, x-axis) activity of one young participant for two surface compliances, 100% and 10% of the product of body mass, gravity, and the height of the CoM (mgh). All data points were normalized to the maximum activity over all trials. Data points in red indicate co-contraction (both muscles active over 10% of maximum). Data points in blue indicate no co-contraction: a SOL TA in a young adult at 100%mgh; b SOL TA in a young adult at 10%mgh

