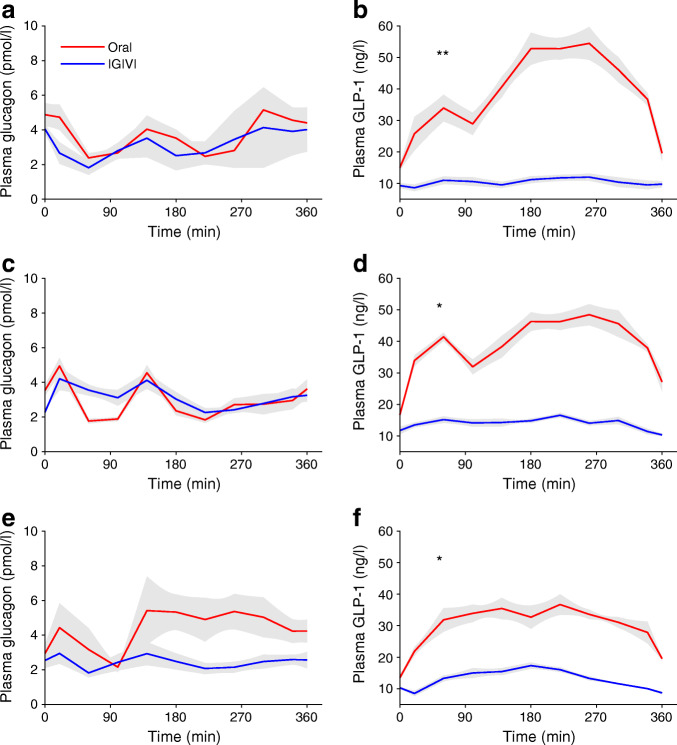
Fig. 3.
Time courses of (a, c, e) plasma glucagon and (b, d, f) GLP-1 levels during the OGTT (oral) or the isoglycaemic intravenous (IGIVI) glucose administration in the three groups of participants: participants with NGT (a, b), IGT (c, d) and type 2 diabetes (e, f). *p< 0.05 and **p< 0.01 by Wilcoxon test comparing the glucagon and GLP-1 AUCs during the oral and the IGIVI glucose administration for each of the three groups of participants

