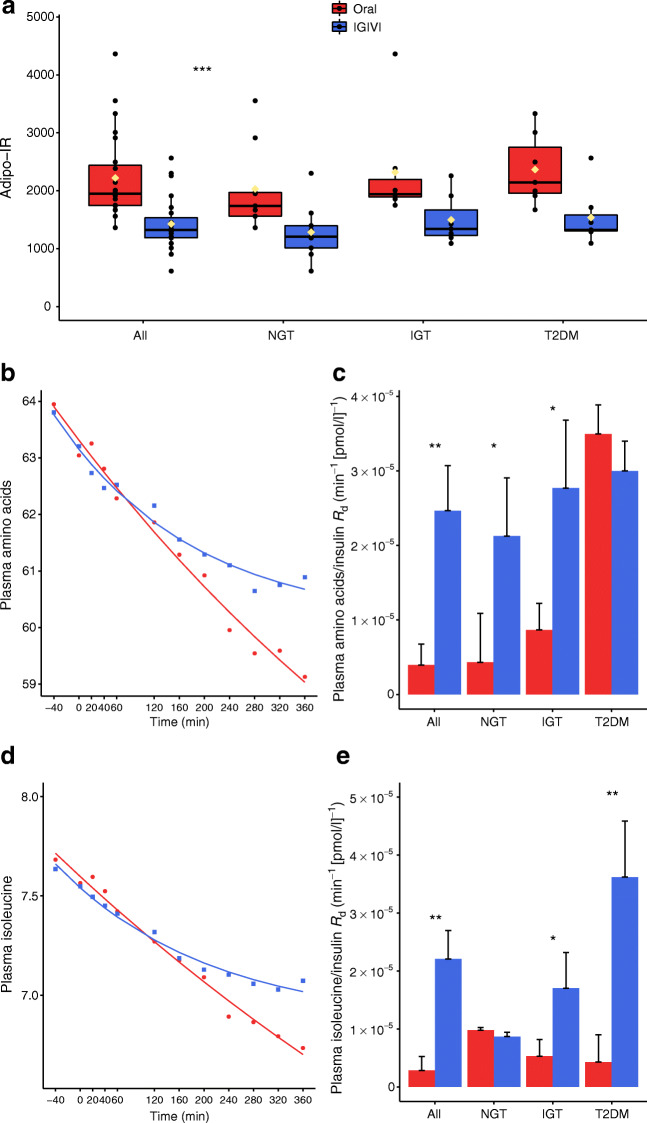
Fig. 5.
(a) Adipo-IR index obtained by multiplying the levels of fatty acids by the average insulin levels during the two procedures (OGTT [oral] vs IGIVI). Black circles represent single participant values whereas yellow diamonds represent mean values. Significant experiment effect from mixed effects model. (b, d) The capacity of insulin to clear combined amino acids (b) or isoleucine (d) from the circulatory stream was estimated by adopting a decaying exponential model (points represent observed values while continuous lines represent model predictions). (c, e) The bar graphs show the values of the estimated Rd normalised by insulin per experimental procedure and glycaemic group. Comparisons between Rd coefficients in each group are from Z tests. *p< 0.05, **p< 0.01, ***p< 0.001 are the test significance for oral vs IGIVI

