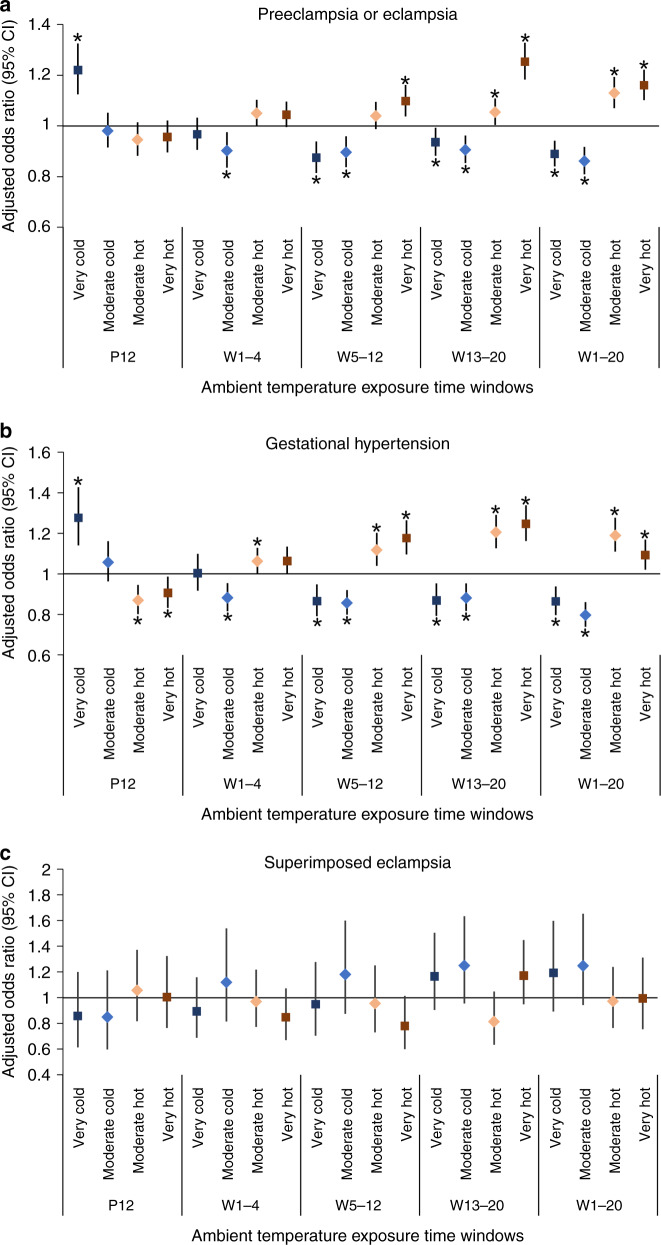
Fig. 1. Adjusted odds ratios of HDP for extreme temperatures by pregnancy periods.
The models were adjusted for the hospital level, antenatal care visits, marital status, region, mother’s education, mother ’s age, parity, number of fetuses, elevation, humidity, and air pollution exposure. a Preeclampsia or eclampsia; b gestational hypertension; c superimposed preeclampsia. Data are presented as aORs with 95% confidence intervals. Black error bars correspond to 95% confidence intervals, center for the error bars correspond to points estimate of aORs. Black stars denote p < 0.05. PC preconception, W weeks postconception. Source data are provided as a Source Data file.

