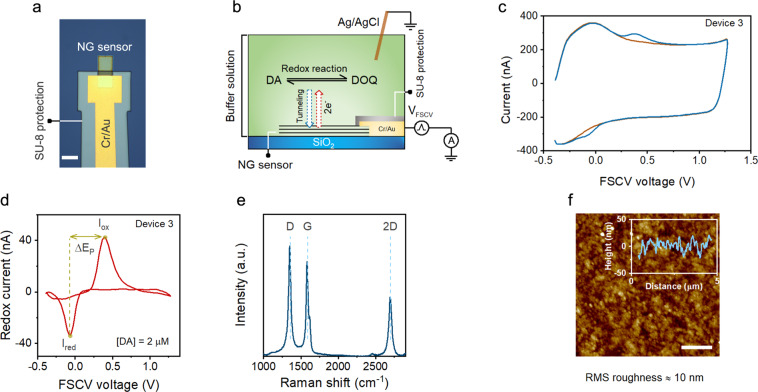
Figure 3.
Characterization of NG micro-sensors. (a) Optical image of an example NG micro-sensor. Scale bar is 20 μm. (b) Cross-sectional schematic of our experimental setup for FSCV measurements of dopamine. A rapid potential sweep (VFSCV) was applied to the NG micro-sensor, and (c) the total current was measured with and without dopamine in a 1X PBS solution. (d) The subtraction of the measured currents before and after dopamine gives the cyclic voltammogram. Additional data showing the consistency of our NG micro-sensors are shown in Section S1 of Supplementary Information. (e) An example Raman spectrum of an NG micro-sensor. We used the Raman spectra of our sensors to quantify the average density of point defects and the size of the graphitic crystallites. (f) An example topographic image of an NG micro-sensor obtained using atomic force microscopy (AFM), showing an RMS roughness of ∼10 nm. The inset shows a line scan. Scale bar is 1 μm.

